Can you trust time measurements in Profiler?
This time instead of only writing a post I also created for you a video on the same topic 🎥. So if you prefer to listen to me talking about measurement inaccuracies in Profiler instead of reading, I’ll be thrilled if you check it out! I’m planning to add more videos for experienced Android Developers in the future on this channel.
Profiler is an excellent tool for looking for performance hotspots in Android apps. It’s embedded in Android Studio, so it requires no setup at all, and it allows us to easily see how much time it takes to execute each method in real-time while we interact with an app.
But have you ever wondered how accurate the results in Profiler really are? As it turns out the results that you see in Profiler are much less accurate than you might expect. And in this post, I’ll explain to you why.
How accurate are the results measured in Profiler?

Let’s say we have an app — the simple list of shoe offers and as we scroll we have an impression that it feels a bit laggy.
So what do we usually do in this situation? We open the Profiler to look for some suspicious code that is making scrolling slow.
In this case, the problem is scrolling performance in RecyclerView so our first suspect should be binding data to view.
And wow, does onBindViewHolder really take over 11ms? No wonder the app feels laggy

Well, in reality, it is not that bad. It’s not great either, the app definitely needs some optimization, but it is not as bad as Profiler suggests.
Systrace
OnBindViewHolder method can be also measured using Systrace with the following command:
We also need to add a custom trace event in the onBindViewHolder method so it’s captured by Systrace.
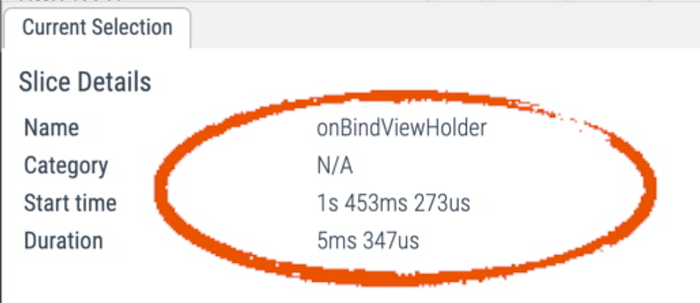
Generated HTML report can be opened in Perfetto and over there we can analyze achieved results. As you can see, the result measured by Systrace is much better than in Profiler — only about 5.5 ms.
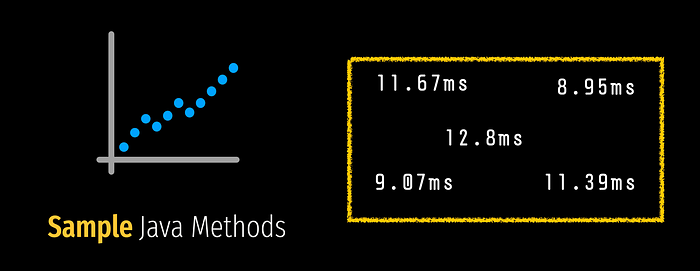
Even on the same recording in Profiler, you may notice that the same method called with the same parameters once takes a different amount of times each time that is called.

In Profiler, you can also see a nice summary that shows the average, minimum, maximum and standard deviation of the measurements for this particular method. As you can see the measured results vary a lot.

Why does it happen? 🕵️♀️
The first reason that might come to mind is the CPU profiling mode that we chose.
1. Sample Java methods mode
In Sample Java methods mode profiler captures app’s call stack at some interval. The interval is of course very, very frequent but it can add some error to our measurements. We can even miss some shorter method calls because of that.
But if it is only the fault of the sampling frequency, maybe the solution is to use Trace Java Method when we want more accurate results?
Trace Java methods mode
In this mode profiler instead of capturing app call stack at some interval, it logs the timestamp of the beginning and the end of execution for each method. That way this mode allows us to not miss any method calls, even those with very short life cycles. Unfortunately, it does not make the results more accurate — on the contrary.
Because of how it works Trace Java method mode adds a massive overhead so it highly impacts runtime performance and it, of course, influences the measurements. We can even see it while measuring that app starts feeling awfully laggy once we hit record.
And for example, the same method that in Sample mode took 10ms in Trace mode may take even 130ms. That’s a huge difference!
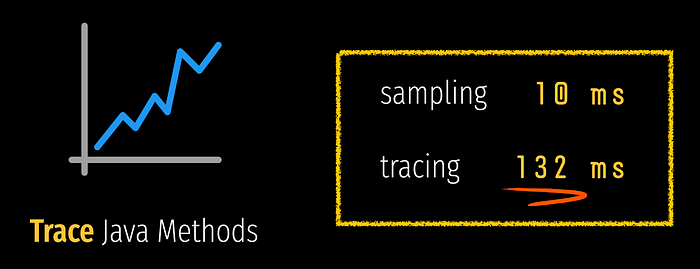
And for methods with shorter lifecycles, it is even more noticeable.
But it’s not only the CPU profiling mode
As you can see, when comparing the results with the one measured by Systrace, both those modes add some overhead to measured data. In Trace Java Method mode it is of course much more significant. But even in sample mode, it is noticeable.
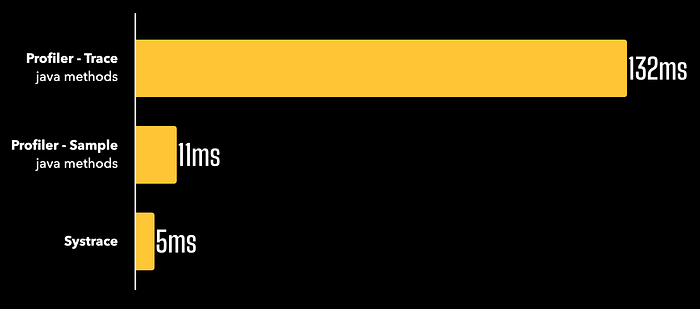
onBindViewHolder measured using different methodsBut Profiler overhead and the sampling frequency is not everything. There is also another reason that is making our results less accurate.
That profiling your app requires it to be in debug mode.
debuggable = true
The code that your users see in release mode is very different from the app in debug mode. Runtime does almost no optimization to your code when it is in debug mode, so the results that you see in profiler may be much higher than in release.
It wouldn’t be that bad if the error was systematic, but It’s not.
Here you can see a graph from the Google IO talk “Improving app performance with benchmarking”.
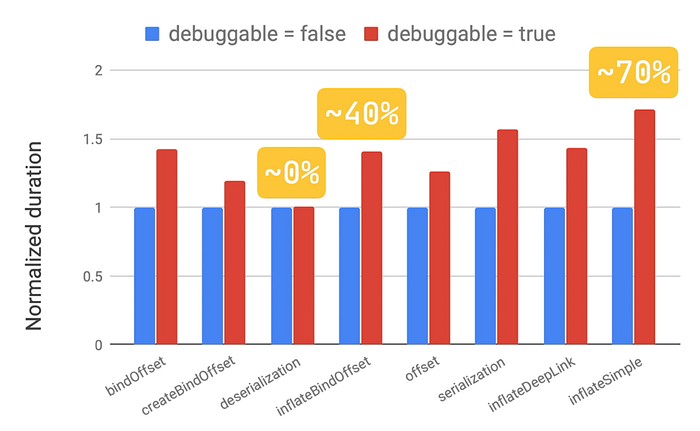
This graph shows the benchmarked duration for some method calls, each measured for debuggable true and false. As you can see for some methods being in debug mode added almost no overhead at all but for some, the measured value increased by even 70%!
What now? Should we not use profiler at all?
Definitely not!
Profiler is a great tool when we want to find what we should focus our optimizations on. It is also very easy to use since it requires no changes in our codebase and no additional setup.
But if we want more accurate results, it might be sometimes better to use something different, like Systrace or Jetpack Benchmark Library. Especially if you need to quickly iterate and reliably test how your optimizations impacted app performance.
All those tools are great. It’s our responsibility to choose the tool that best suits our needs.