Android debug tools

Improving the quality of services and products is an extremely important topic for software development industry. The development process includes a lot of parts that need to be worked out continuously. In this article we will speak directly about program code debugging as my area of expertise. Debugging is one of the most important part of the software developement process. To provide the high-quality product to users we should find and fix bugs quickly and timely.
In Techery, we strive not only to meet but also exceed the expectations of our clients and technical partners. We have used many different debug tools and each one has its own advantages. It is not convenient to have a lot of dependencies in a project and switch all the time between different tools to inspect network or database layers. A long time we have looked for the solution which meets all our needs until one day came up has an idea to create our own.
I would like to share the experience of usage different debugging tools and decided to create a series of articles on this topic:
- Android debug tools — Android apps debugging tools overview
- Android SQLite debug tools — overview of tools for Android SQLite database debugging
- Android log debug tools — an overview of tools for logs tracking
- Android HTTP debug tools — overview of tools for Android HTTP debugging
We would like to make overview and share our experience of usage of different debug tools and hope this article will help you to decide which one you shoud use.
Android Profiler — profiler of Android Studio
Facebook Stetho — debug bridge for Android apps
DebugDrawer — drawer for faster development
AppSpector — debug tool for Android and iOS
Android Studio Profiler
The Android Profiler tool provides real-time data to help you profile network layer and understand how your app uses CPU, memory, and battery resources. Since Android Studio 3.0 version you enable advanced profiling that works when your app is launched on the devices with Android 7.1 and higher.
Features
The profiler window shows the CPU, memory, network, and battery usage and looks the following way:

Network inspection
If you click on the network timeline the profile shows you the detailed info about requests.

The window above contains the Connection View tab that shows a list of requests with size, time, status, request, response, and time.
Memory inspection
The Memory profiler shows graph with RAM usage and looks the following way:

Using this feature you can find functions that create extra objects and decrease amount of garbage collection events.
Advanced profiling
You can edit the Run configurations of your app to enable the Advanced profiling option as on the following screenshot:
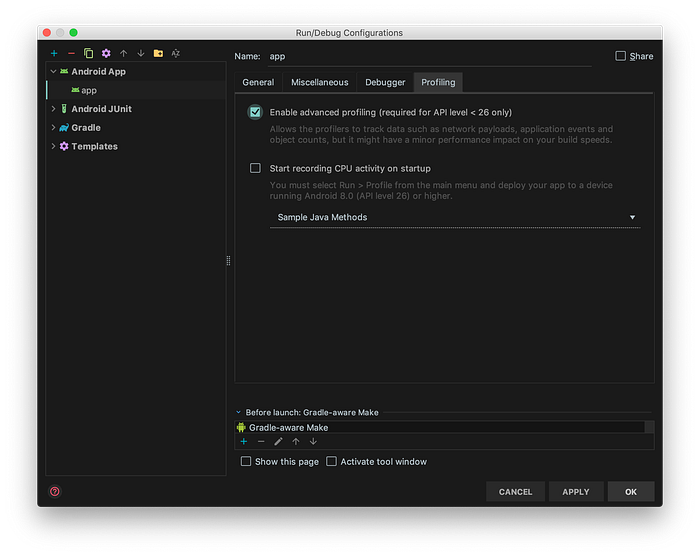
Features provided by advanced profiling:
- All profiler windows support the event timeline
- Memory Profiler shows the number of allocated objects
- Memory Profiler shows the garbage collection events
- Network Profiler shows details about all transmitted files
Pros and cons
Android Studio profiler works out of the box and you don’t need to integrate third-party dependencies into your project. The available monitors(Network, CPU, Memory, and Energy) show really exhaustive info about your app. I really like this implementation of the Network monitor because you can select a timeframe on the timeline and thoroughly inspect requests.
There is no profiler for database and it is the biggest disadvantage, in my opinion, what makes us to use other tools, for instance the SQLStout plugin that will be overviewed in our next article about SQLite debug tools.
Facebook Stetho

Stetho is a debug bridge for Android that allows you to access to the Chrome Developer Tools to inspect your app.
Integration
To download the core Stetho library to your project add the following line to the dependencies block:
implementation 'com.facebook.stetho:stetho:1.5.0'
implementation 'com.facebook.stetho:stetho-okhttp3:1.5.0'
To initialize Stetho you should be adding the following line to the onCreate method of the Application class of your app:
Stetho.initializeWithDefaults(this);To make Stetho able to show network data with the OkHttp client you should add an interceptor like this:
new OkHttpClient.Builder()
    .addNetworkInterceptor(new StethoInterceptor())
    .build()
Features
Stetho allows you to inspect a network and storage layers of your app.

You can switch between inspectors using tabs.
Network inspection
The Network tab shows a table with requests and looks as follows:

The table shows a status, type, time, size, and method of each request. You click on a row to see detailed info:

Database inspection
The Resource tab shows SQLite table of your app and looks the following way:
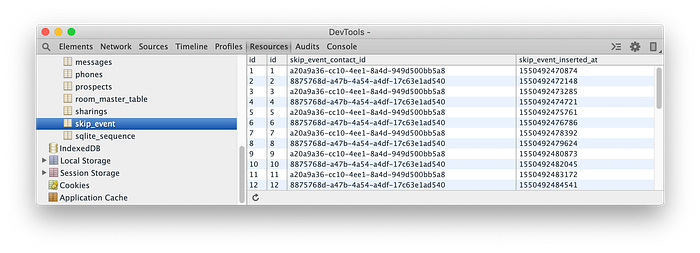
This window is a simple table without search and paging. It may also contain bugs, for instance, on the screenshot above you can see two id columns.
Sample project
You can find the sample project here: https://github.com/facebook/stetho/tree/master/stetho-sample
Pros and cons
Stetho is a free tool that allows you to inspect network and storage layers. You can also install the Stetho-Realm library of you need to inspect Realm database. Stetho is free and it is easy to get started but it contains bugs, ugly user interface and poor functionality.
DebugDrawer
There are many libraries that allow you to integrate a configurable navigation drawer in your app. All of them have similar functionality.
Integration
To download DebugDrawer you should add the following line to the dependencies block of the build.gradle file:
debugImplementation ‘io.palaima.debugdrawer:debugdrawer:0.8.0’You can configure the debug navigation drawer functionality by adding different modules to your project. For instance, if you want to inspect the network layer of your app you can add the following line:
implementation 'io.palaima.debugdrawer:debugdrawer-okhttp3:0.8.0'To initialize DebugView you should add the following lines to the onCreate method of your Activity .
Features
The navigation debug drawer depends on your configuration may look the following way:
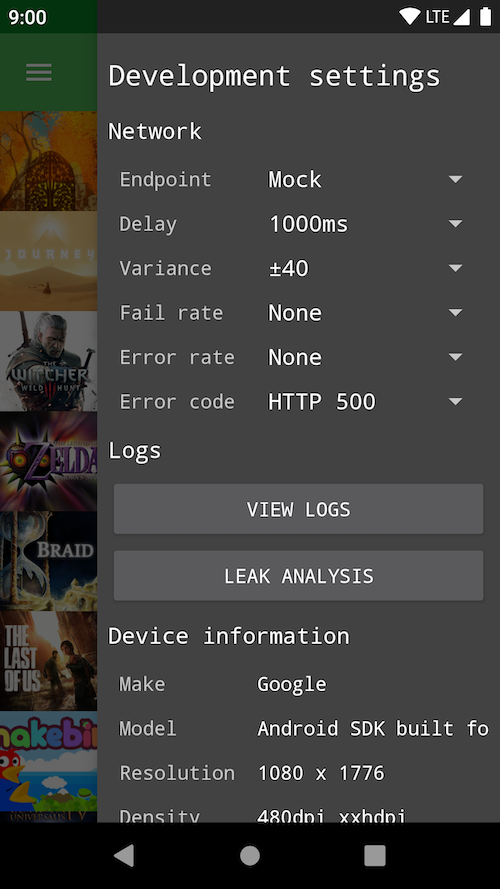
DebugDrawer allows you quickly check info about your device, change settings or mock location.
Network inspection
DebugView uses the Chuck library under the hood and allows you to inspect network requests.
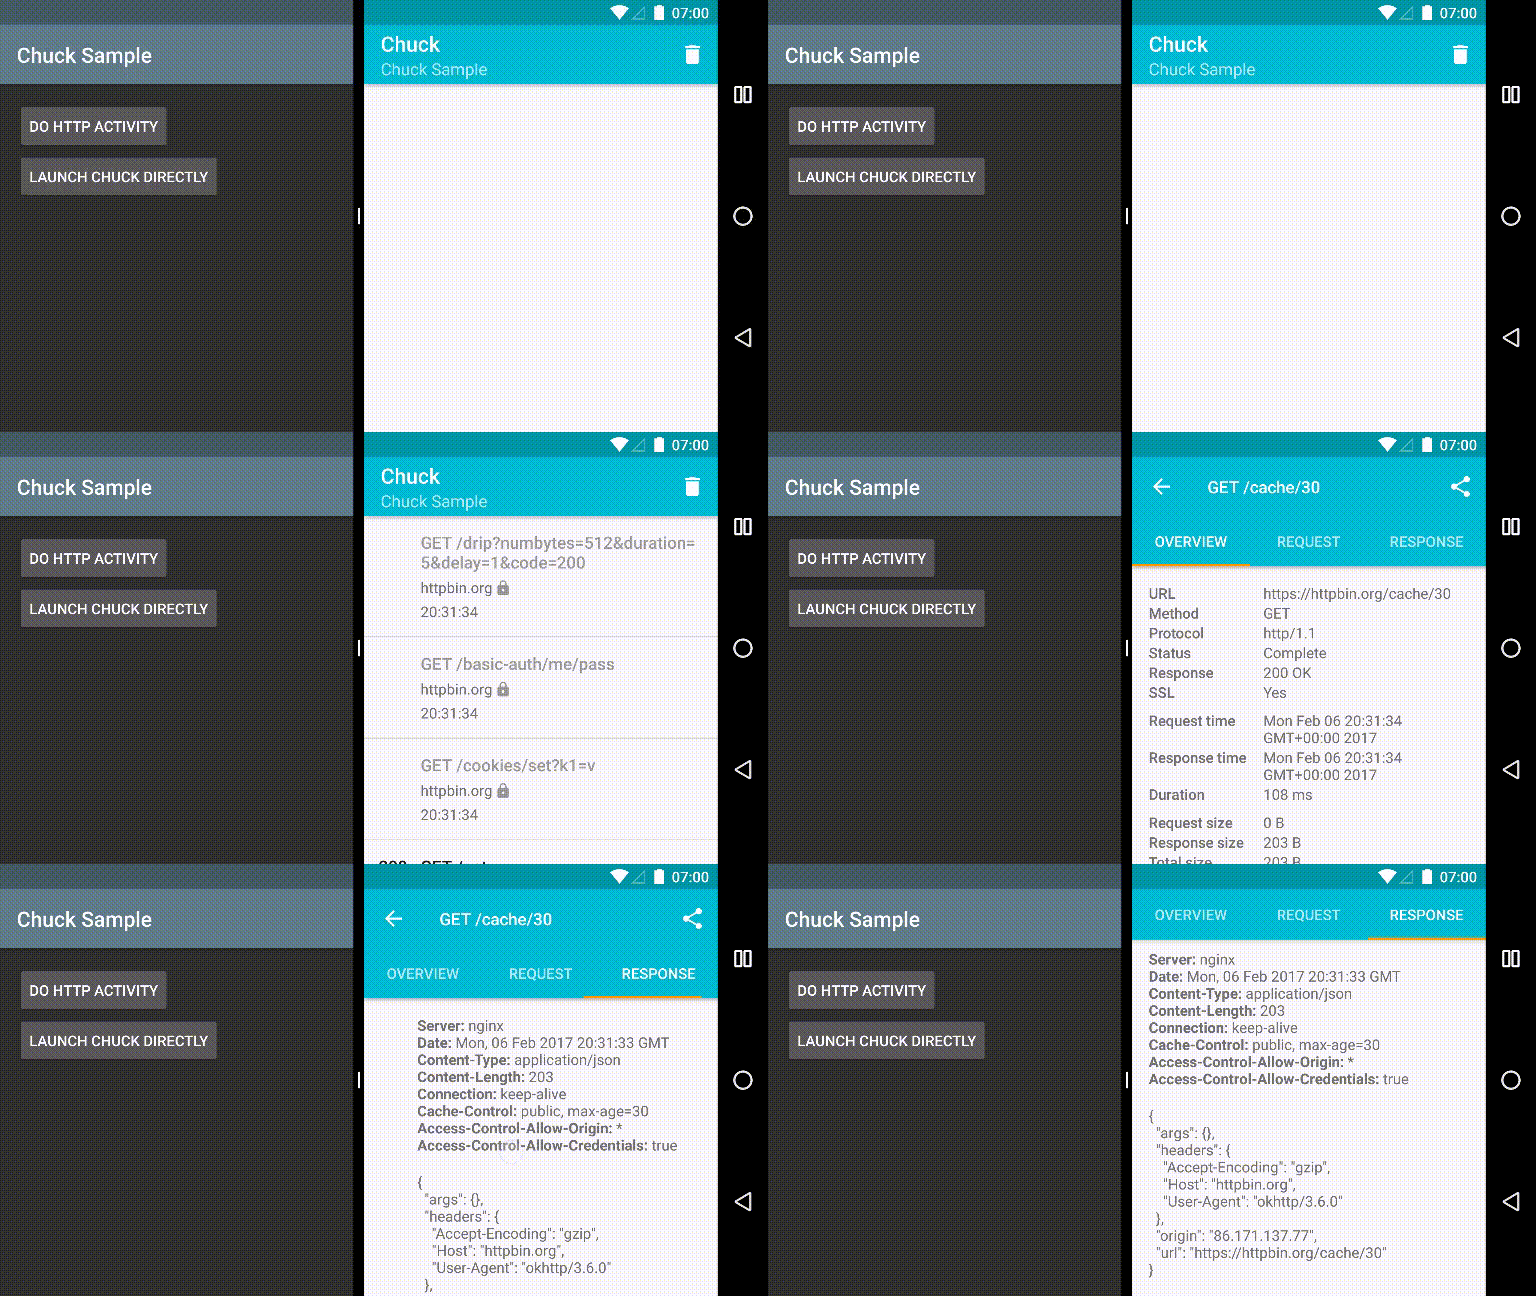
The Chuck library shows a list with all requests and allows you to check details.
Sample project
You can check out the sample here: https://github.com/palaima/DebugDrawer/blob/master/app/src/main/java/io/palaima/debugdrawer/app/DebugViewActivity.java
Pros and cons
DebugDrawer gives you quick access to the device info and settings, allows you to mock location and network connection state. This can simplify a process of testing but it is hard to inspect network request on the screen of a mobile device. There is also no functionality for database layer inspection.
AppSpector

AppSpector is a service for debugging iOS and Android apps that allows you to inspect and control your apps remotely in real-time using a simple interface. The full documentation available here.
Integration
To get started with AppSpector you should go through a simple registration form and create your project or add an organization.
To integrate AppSpector into your app you should modify the build.gradle file in the following way:
buildscript {
    repositories {
        jcenter()
        google()
        maven {
            url "https://maven.appspector.com/artifactory/android-sdk"
        }
    }

    dependencies {
        classpath "com.appspector:android-sdk-plugin:1.+"
    }
}

apply plugin: 'com.android.application'
// Put AppSpector plugin after Android plugin
apply plugin: 'com.appspector.sdk'

repositories {
    maven {
        url "https://maven.appspector.com/artifactory/android-sdk"
    }
}

dependencies {
    implementation "com.appspector:android-sdk:1.+"
}
And initialize AppSpector in the onCreate method in the Application class of your app:
AppSpector
        .build(this)
        .withDefaultMonitors()           .run("android_OGMyYzA3NGYtNDkxNy00ZWRiLTgxOTktNjQ5YjIzMTZjOWM4");
Features
When you run your app a new session will be created and you will see it in the main AppSpector window in browser.

When you click in a certain session you can inspect your app using different monitors.
Performance inspection
The Performance window shows graphs with different metrics such as CPU, Memory, Network, Disk, FPS, and Battery usage.

This monitor helps to detect resource leaks, usage of disk, and FPS.
Network inspection
The Network monitor shows a table with requests so you can click on a certain row to see details info such as request and response.

This window also contains the search, filter, and export functions.

It is really convenient to use them if you have a large app.
Database inspection
The SQLite monitor allows you to inspect a database and invoke SQL requests.

It is easy to search a certain record because this monitor contains handful paging.
Pros and cons
AppSpector has perfect user interface. It is easy to navigate through it and find needed monitor. You can share your session with your teammates just by coping url address from a browser and sending it. The shared session is available for all members in your organization. AppSpector contains many different monitors with handful search and filter options. The trial period is 14 days. AppSpector also supports two platforms: iOS and Android. You check the live demo here.
Conclusions
Now, we are about to end this journey through debugging tools for Android. We shared our experience of different profilers usage and explained why we decided to create our own. In the next articles we will go deeply and make overview of tools for a specific layer of app such as network and database. Join to our Slack channel. Thanks for reading and stay tuned!


