Android SQLite debug tools

Using SQLite is a common approach for creating persistence storage on the the device. The process of development can be much easier if a developer uses a special tools for debugging. It will save you time and increase the quality of your product. There are a lot of different solutions and it is hard to choose one. In this article, we will make an overview of the most popular debug tools for SQLite and share our experience of their usage.
This article is part of debugging tools series:
- Android debug tools — Android apps debugging tools overview
- Android SQLite debug tools — overview of tools for Android SQLite database debugging
- Android logging tools — an overview of tools for logs tracking
- Android HTTP debug tools — overview of tools fir Android HTTP debugging
Before we begin, let’s define requirement for database debugging tool.
- It should provide access to database tables and their content
- It should allow us to execute SQL query to get or modify existing data
- It should allow us to do it remotely, for example if we have issues on customer’s device and we need to debug it
Our overview of SQLite debugging tools covers the following topics:
- SQLScout — a plugin for Android Studio and Intellij IDEA
- Stetho — a debug bridge for Android applications
- AppSpector — a service for debugging Android and iOS applications
SQLScout

SQLScout is a plugin for Android Studio and Intellij IDEA which allows you to connect to SQLite databases, browse tables and schemes.
Features
SQLScout is an extremely powerful tool for SQLite debugging. The core features:
- SQLite Explorer
- SQLite Editor
- Data console
- Database diagrams
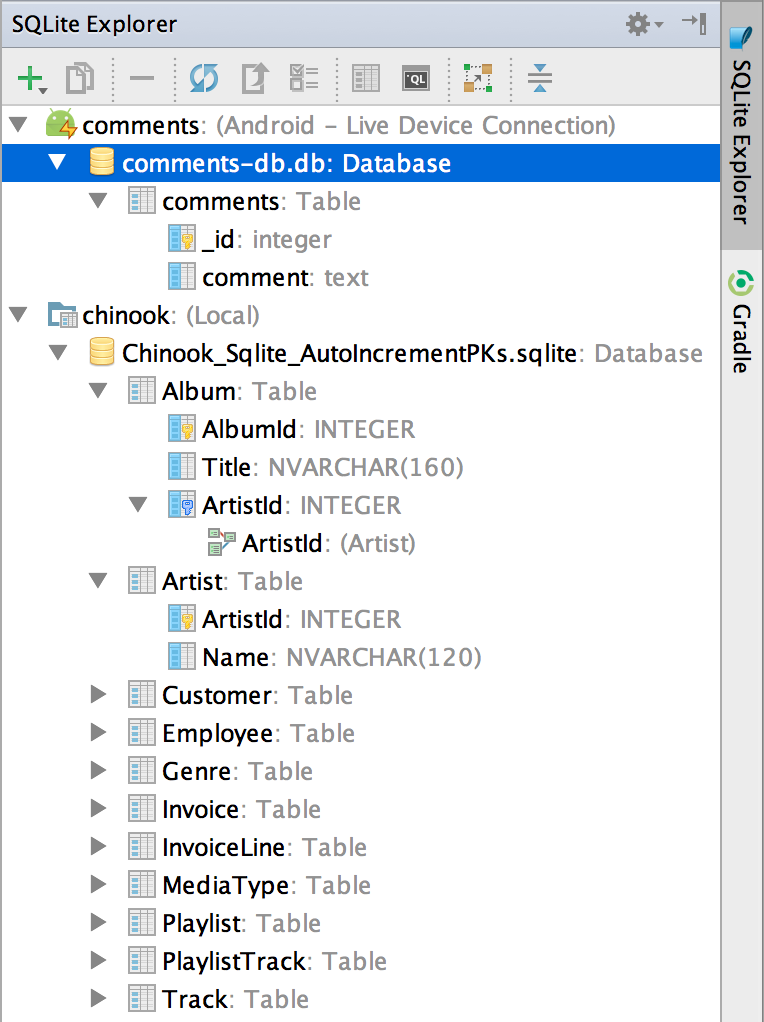
SQLite explorer is a main window of SQLScout that shows databases, tables, and columns using a tree view. It allows you to overview a scheme of databases, upload a new database or synchronize existed. SQLite explorer also provides navigation options to other windows such as SQLite editor, data console, and database diagrams.
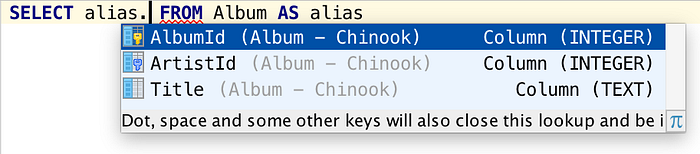
SQLite Editor includes a file-based and in-memory SQL editors. It is a powerful editor with a lot of features such as syntax highlighting, code completion, navigation to schema and alias definition.
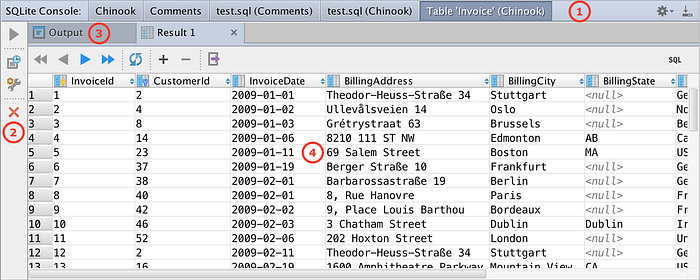
Data console displays query results and allows you to edit table data, and to export its content to different formats.
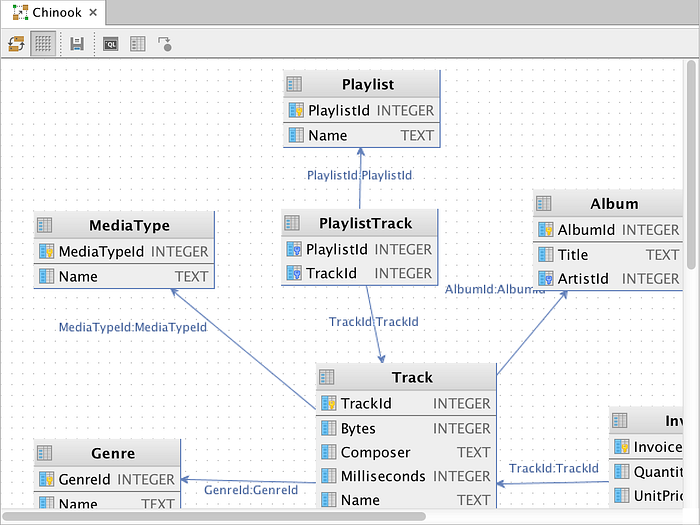
Database diagrams window shows generated diagrams for databases with visualization of tables, columns and relationships.
Pros and Cons
SQLScout is a really powerful and well-documented tool for SQLite debugging. It includes a lot of features that can satisfy all your needs. But there is no functionality which allows you to inspect a database remotely. You have to physically connect your device. Since SQLScout is a plugin you need to install it just once and there is no need in integration for each of your projects. Trial period is 14 day and free plans are available only for open-source developers.
Stetho

Facebook Stetho is a debug bridge for Android that allows you to connect to a device and to inspect your app using Chrome Developer Tools.
Features
Stetho allows you to inspect databases, network requests, and shared preferences using the Chrome Dev Tools.
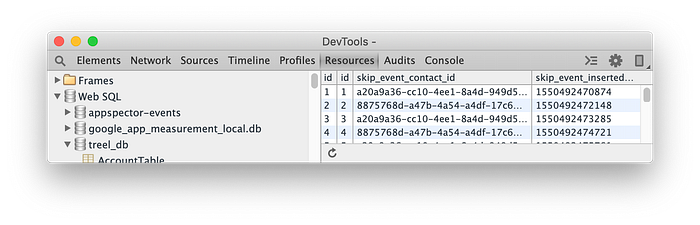
Database inspector window is divided into two panels. The left panel shows a tree view with databases and their tables. The right panel, in turn, shows details of current selected database. There are no options for search, filtering or editing.
Pros and Cons
Stetho is a free tool that allows you to explore scheme of your database and overview current records. But if you need advanced options, such as editing, you need another solution and there is no functionality that allows you to inspect a database remotely over internet, only in local network.
AppSpector

AppSpector is a service for debugging iOS and Android apps which allows you to inspect and control your apps remotely in real-time from a simple web-interface. Just imagine that you have a customer or teammate in another country and they have bug on their phone. With AppSpector you can connect to app running on their device and find the root cause. It’s a real timesaver.
You can check out live demo here: https://appspector.com.
Features
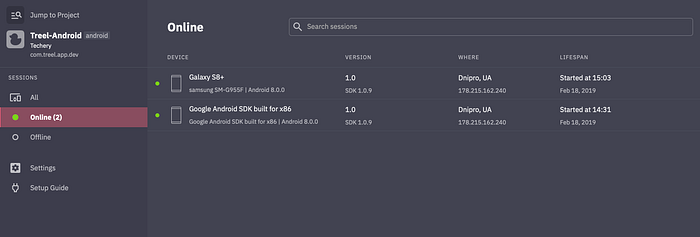
AppSpector allows you to inspect your app using sessions that are available online for your team. Session is extremely powerful AppSpector feature because you can share a session with your teammates and they will be able to use it remotely in a real-time.
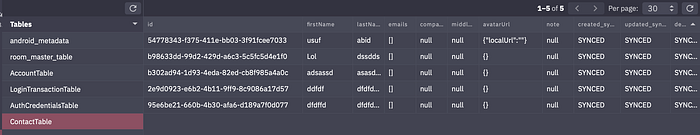
The SQLite monitor allows you to inspect a database and execute SQL query. It is easy to find needed records using SQL query and pagination which allows you inspect effectively the whole table step by step.
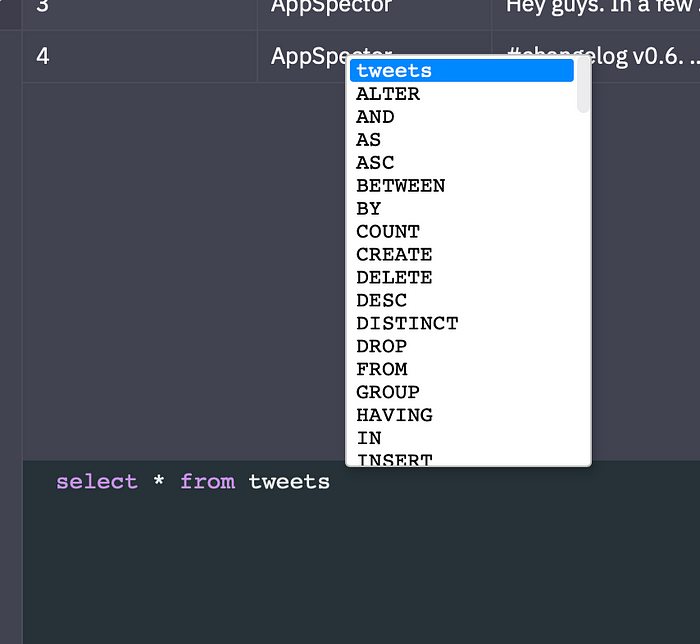
SQL request editor has useful autocomplete and the result of a query will be immediately displayed in the table.
AppSpector also allows you to overview a scheme of a table that displays name, type, and constraints of columns.

Pros and Cons
AppSpector is a uniq tool for debugging iOS and Android apps so you can inspect performance metrics, network layer, location, screenshots, logs, database and shared preferences. But the main killer feature is remote access. It works over internet and it’s super fast. Also all logs, HTTP requests and shared preferences are stored for offline access. Even if app is closed you can get access to it.
It has 14-days trial period, free plans, slack channel, and documentation.
Conclusions
In this article we made an overview of different tools for SQLite debugging for Android. It is better to use a special tool because debugging of SQLite database can be really tricky. SQLScout is an extremely powerful tool with a lot of functionalities, but many of them are not necessary for debugging. Stetho is a simple and free solution. AppSpector covers debugging needs for both Android and iOS and provides many additional features, such as network logs, app logs, location mocking, and performance profiling. I hope we will help you to make the right decision.
Thanks for you reading!