Watcha Doin’? Inspecting Kotlin coroutines with timing graphs.

So you’re really into Kotlin development and think coroutines are dead easy… well, this is what I thought until I started verifying my coroutine beliefs against the actual behaviour.
Seeing is believing and believing is knowing and knowing beats unknowing and the unknown. — Philip Roth
Visualize
There are already tools out there that let you analyse your application performance and show you the results. Probably the best known visualisation method are flame graphs invented by Brendan Gregg.
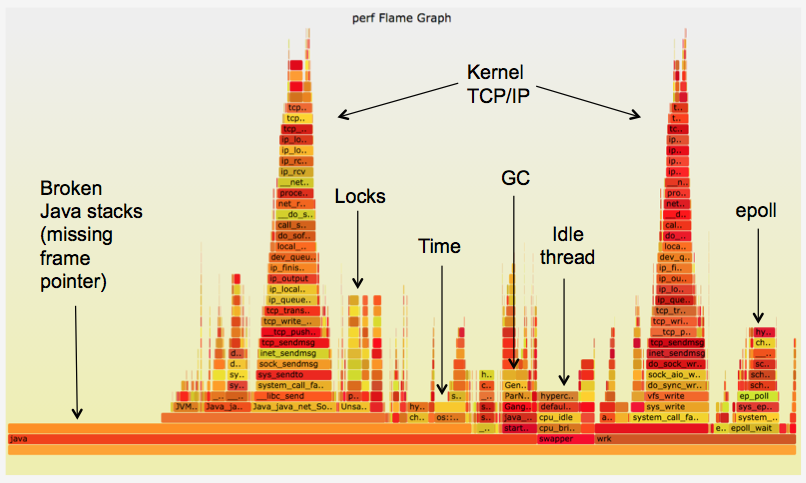
These graphs are usually based off sampling profilers. They can combine system and application events into one digestible graph that allows you quickly find offending methods that might be underperforming.
With Kotlin Coroutines however there are new challenges. Internally coroutines are state machines and if you ever started to debug any code involving them, you can see the stack trace is kinda segmented. If you apply a flame graph to coroutines the information about causality of the problem might be lost.
JProfiler is another quite popular method to visualize execution timelines—I must add this one has recently added a support for coroutine stacks as illustrated below.

While this approach shows you how your concurrency is structured I find the time flow much harder to follow comparing to the flame graph.
On top of that, both profiling methods require quite some time to set up and get running. If you were in my position, trying to understand basic building blocks of coroutines, you might find these tools an overkill. This is why I decided I needed to have something simpler.
Inline functions to the rescue
When I saw for the first time how easy it is to measure time in Kotlin using measureTimeMillis it blew my mind 🤯 — This method became my starting point for writing my own profiling tool.
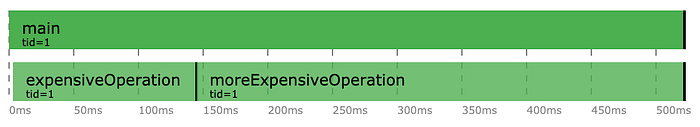
The above code will complete within about 0.5 seconds and the sum will be 3. While we measure overall execution time with ease we don’t see relations between expensiveOperation and moreExpensiveOperation.
Obviously this wasn’t good enough — I wanted to see how each of these nested operations relate to each other. This is how watch-a-doin library was born.
The watch-a-doin library is meant to keep the simplicity of Kotlin’s default time measurement while at the same time provide a way to create nested measurements. Here’s how it could be applied to previous code example:
The central piece of this library is a class called Stopwatch. You can start/stop and timeout your watch. The watch holds the measurement information and allows you to spawn child watches if you need to go deeper.
I overrode object invoke operator to achieve an API similar to “measureTimeMillis” and then added a String extension scoped to Stopwatch class to make child stopwatches creation easy.
The elapsed time value gets stored within the Stopwatch itself. This allows us to make our measurement block return any value which makes it e.g. easy to add to the existing functions.
Once your stopwatch is done running, you can create a text report that describes in depth what has happened.
…or even better, you can create yourself a beautiful* SVG with all the timings!
*I’m not a designer
The timings graphs come with a tid parameter, which stands for Thread ID — this information comes handy in situations where you need to verify if your task of interest is running on a correct thread.
Now having our basic tooling ready we can slowly start a descent into more advanced coroutine timings.
Iterating Coroutines to General Betterness
Let’s iterate on our previous code with some more iteration and emojis. Consider the code below
It will result in the following timings.
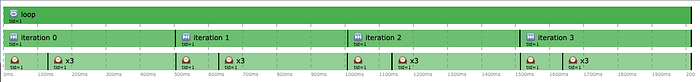
Linear execution, no extra threads. Easy.
Now almost anyone who has come across coroutines have heard this story (Let’s run a lot of then) how Thread.sleep is blocking and how Kotlin’s suspending delay is much better.
So how about we start using coroutines but keep Thread.sleep around for now to verify that story? We could assume the total execution time should not change, right?
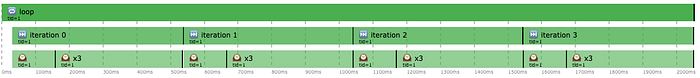
Well… not really. It turns out somehow everything got executed in parallel.
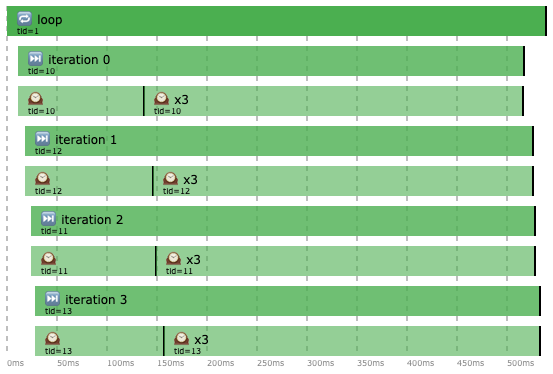
So what really happened here? First off, using GlobalScope is not a good idea. Technically speaking this code completed faster so you might think it’s “better” but as tid values show above, using GlobalScope resulted in creating 4 new threads! Thread creation can be expensive and will simply burn your CPU 🔥🔥🔥. Let’s fix this and use structured concurrency properly.
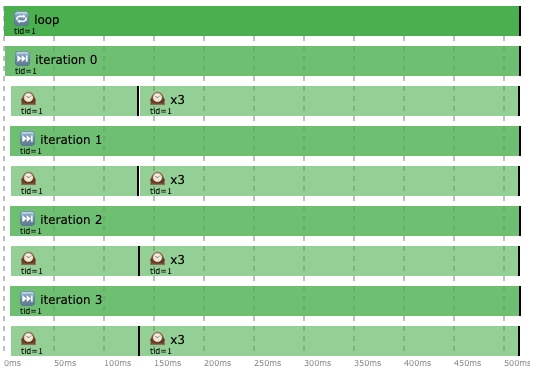
…and our timing is back to 2 seconds — we fixed the thread surplus and now everything runs 4 times slower. GOOD JOB EVERYONE 🎉
Important thing to observe here is all the execution happens on the same thread. You can indeed see that Thread.sleep does block us from executing our iterations in parallel — this is not something easily deductible if you only look at the loop code.
On the bright side we made our code simpler — there’s no need for us to collect job references and then wait for all of them to complete. Instead we’re using runBlocking + launch and let the structured concurrency do the job management for us.
Now let’s make this code execute fast again 🏃♀️
Here’s our blocking expensiveSleep
we’re replacing it with a non-blocking “expensiveDelay”
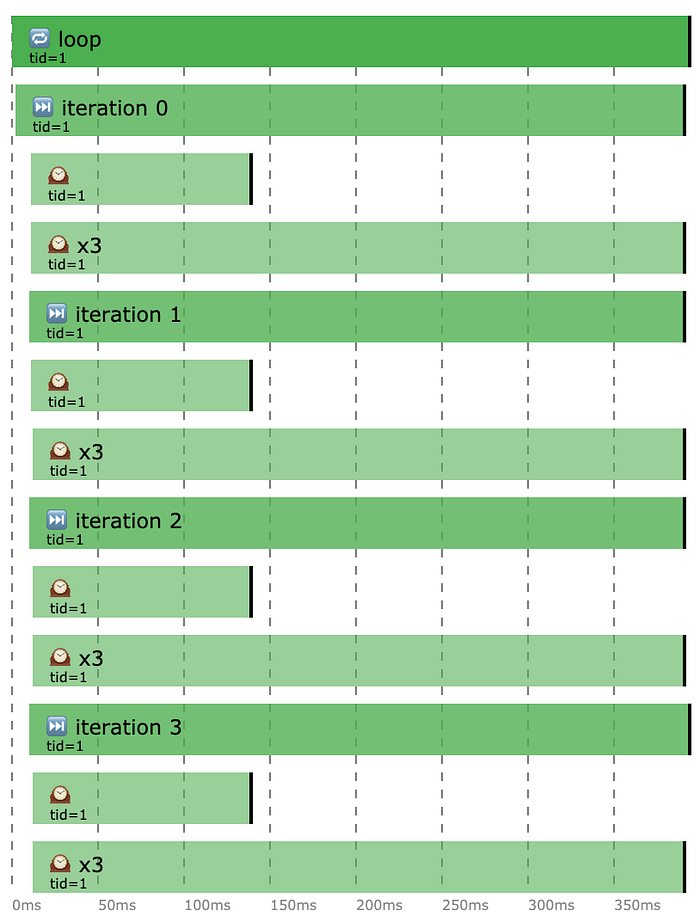
…and just like that 75% of our execution time is GONE!
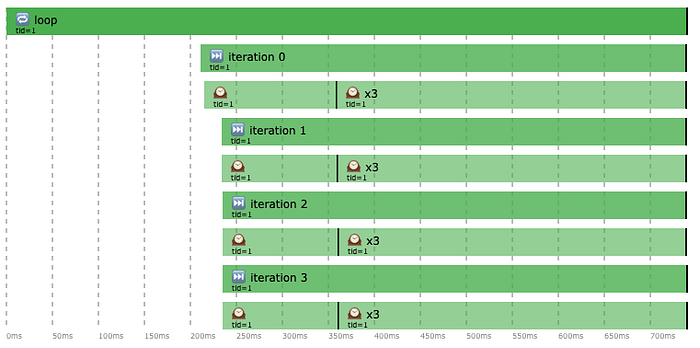
Great! Except WTF is that 200ms delay before hitting the first iteration?!
Turns out it has something to do with runBlocking and executing this code snippet via JUnit single test mode — cold start or whatever 🤷. I added extra watch to measure time before and after runBlocking to verify it, like so:
…and here’s what it revealed:
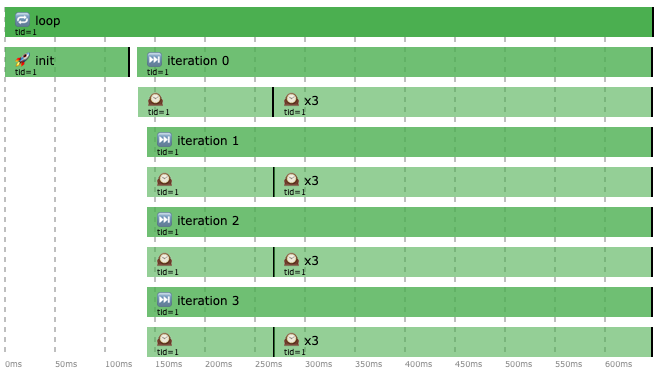
Initalizing runBlocking takes those ~200ms. However if you run all these tests together in one go, the init will barely take any time and total execution time will take 0.5 seconds as expected.
I ended up fixing this issue by adding a warmUp method to always run before any other tests. This way measurements don’t seem to be affected anymore by coroutines’ internal warm up time.
Anyway… could we make all of this even faster?🏃♀️🏃♀️🏃♀️
Yes, we can! We run two operations within the loop sequentially, it should be rather easy to launch them in parallel using async, shouldn’t it?
…well NOPE 🙃
We improved nothing.
OK, so the obvious mistake here was putting await() before getting to the second async. The correct version looks more like this:
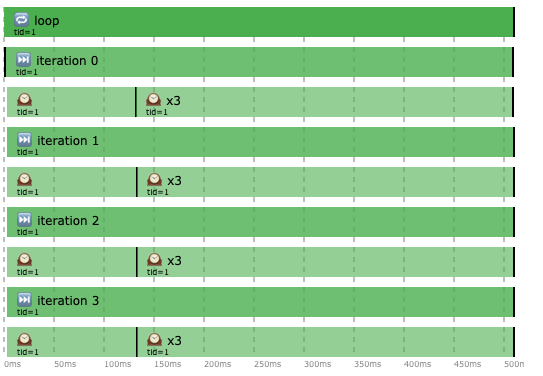
await() will block your code so use it when you really need it. In this example we don’t need the value right away but only later when we want to calculate the sum. This is how our final graph looks like.
We managed to go down from 2 seconds to merely 375 ms. All of this happening on a single thread. I’d say it’s a big win!
Conclusion
When writing concurrent code we are often locked to the text based IDE and depend on our own imagination to predict how the things are “supposed” to work. The problem discussed in this article was relatively simple yet we could iterate 7 times over it, progressively making it better. In the real life scenarios you have a high chance of creating much more complex code. It might be a good idea to somehow verify what the code you write is doing and watch-a-doin library might be just the right tool for you.
The watch-a-doin library is a tool we use internally in one of our Kotlin based microservices at EyeEm . Timing graphs already allowed us to identify a couple of major issues and ensure decent response times at large scale. We’re happy to make this solution available as open-source — SVG rendering might still be a bit rough but it gets the job done. Be sure to ⭐ the project on GitHub — contributors are always welcome.
If you want me to cover any other coroutine concepts with timing graphs, please leave your feedback in the comments below. Thanks for reading 💖 …and if you liked the article don’t forget to hit the clap 👏 button couple of times ;)
Let’s stay connected — I’m @vishna on twitter/github/kotlinlang.slack.