Sonar-like animation

Android makes UI development interesting and fun by giving the ability to create some custom widgets or animations. Today let’s try to make some fun by creating a sonar-like animation:

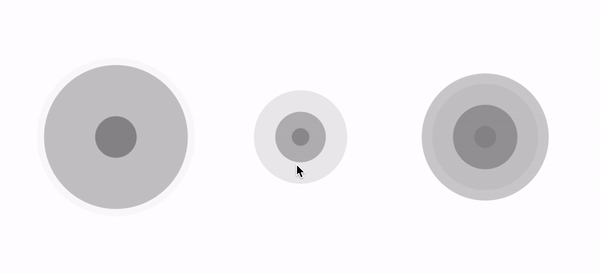
The design team has provided the following sonar icon and the PM has made a proposition to make an animation on it.

Linear animation
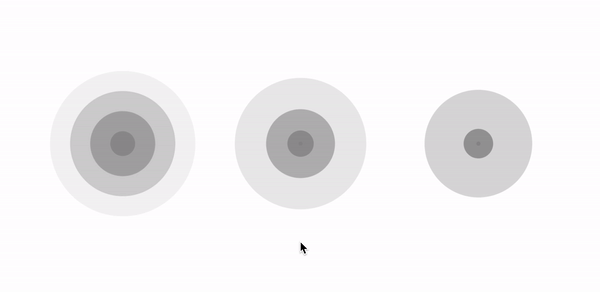
Let’s start with our first iteration. To start with, we need to describe what we want to have in the end. We want to have ripples growing from the center of the icon to the end and fading along the way. The illustration below gives a good idea of what we want to achieve :)

We will create a SonarDrawable for that which will be automatically animating depending on its own visibility. The first version will include just a fade and expanding of ripples, that will linearly depend on time:
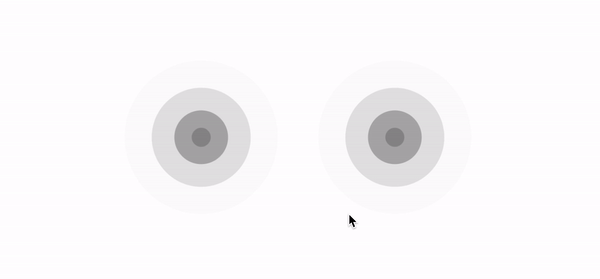
The result will look like the following:

Interpolators
Next, let’s try out different interpolators to our solution since the linear animation makes it look clumsy and wooden.
We want to make our solution configurable, that’s why we will pass the Interpolator's implementation into SonarDrawable and inside progress property let’s add this line:
val adjustedValue = interpolator.getInterpolation(value)Now let’s see the result for AccelerateInterpolator which looks like the first try-out-candidate. In the GIF below you will see three animations. Each animation for different factor argument of AccelerateInterpolator constructor:
Also, let’s look at other interpolators: DecelerateInterpolator, AccelerateDecelerateInterpolator and FastOutSlowInInterpolator.
Custom curve
Actually we could apply AccelerateInterpolator but it would restrict us in terms of configuration. Besides (and this is really important), I wanted to have the exact icon in some state of that animation, which is really hard to achieve with AccelerateInterpolator.
So let’s try another way. Let’s add the two arrays: scalesArr and alphasArr. The first array will contain the scale values in different timestamps. The second array will contain alpha values. Let’s describe the work of scalesArr (the same logic will be applied to alphasArr as well). In this array, we define the scale values from 0 to 1 in a fixed time moments. Those moments calculate relatively array size. Suppose we have scalesArr = [0.0, 0.1, 0.2, 0.8, 1]. We can emphasize our animation duration and starting delay through a relative range [0, 1] where 0 — is a starting point of animation and 1 — is a finishing point. Giving that. We just split our time range in four small ranges for our scalesArr: [0, 0.25], [0.25, 0.5], [0.5, 0.75], [0,75, 1]. In other words for the array arr with size N we split our time on N-1 equal ranges, and in each range i our value will be linearly changed from arr[i] to arr[i+1].
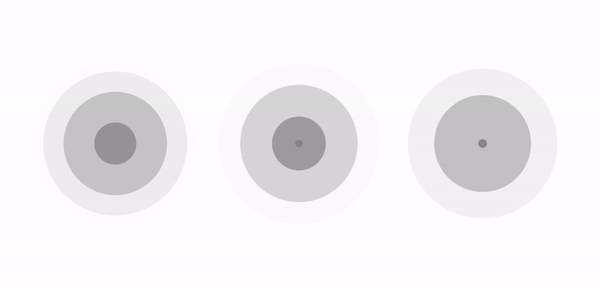
I just took the starting icon with three ripples and used each one as some state in which I want to see every ripple during its ‘lifetime’. As a result, I’ve got:
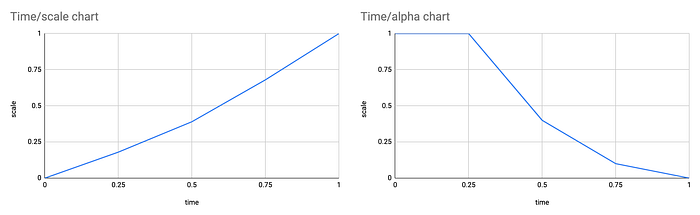
scalesArr = [.18, .39, .68] & alphasArr = [1f, .4f, .1f]We can also see the graphs of changing scale and alpha values during animation lifetime, giving those arrays:
Okay, now the code part. We need to make two adjustments in SonarDrawable class. The first one will add zero and one to both starting arrays. It is just for convenience. Instead of sending [.0, .18, .39, .68, 1] you just need to send [.18, .39, .68]:
Note: this is just an optional thing because maybe you want to explicitly define corner values by yourself, which is more flexible.
The second is the way of computing intermediate values. So in the progress property instead of using raw value argument that came from the caller, we need to adjust it, using next methods:
Let’s look at the result and compare it with the original one:
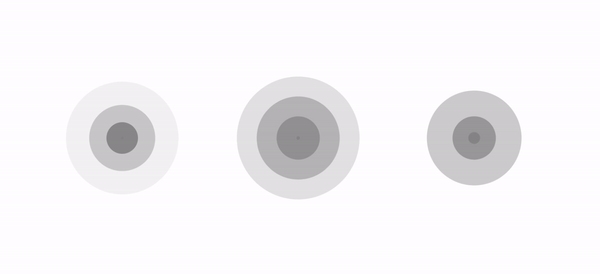
As for me, the final result (left one) looks more natural and more comfortable to eyes. With this solution we also get nice flexibility. Those arrays give us the good possibility of setting up our own animations. Let’s see, what we can do, just simply putting different values in the scalesArr and alphasArr:
The full code of final SonarDrawable you can find here. :)
Bonus: PathInterpolator
While I wrote this article, I discovered that everything is already written for me, which is as always sad for me personally. You can achieve full customization by using PathInterpolator. The principle is really simple:
You define your graph of changing by describing a path, through which the value will go, and putting this path into specified interpolator
This is why I like to write articles. Because it helps me to restructure things in my head, recheck the information, and possibly find a better answer. I wrote an article a couple of years ago related to that topic.
So let’s convert our two arrays [.18, .39, .68] & [1f, .4f, .1f] into paths:
The result is exactly the same as for our arrays:
The full code of SonarDrawable with support of separate interpolators for scales and for alphas you can find here.
Afterwords
That’s it. And that’s for me why I went to UI development and why I love it! :)

If you liked that article, don’t forget to support me by clapping and if you have any questions, comment me and let’s have a discussion. Happy coding!
Also, there are other articles, that can be interesting: