Exploring the .class side of Kotlin

Understanding the software stack is a key trait of an expert developer. Knowing various parameters and metrics allows developers to make mindful decisions about their systems.
Kotlin is an amazing language, now officially supported by Google for Android development. Kotlin makes your code cleaner and expressive while maintaining complete Java interoperability.
There are many great articles about how Kotlin achieves specific things under the hood. Data classes, lambdas and null safety are the tip of the iceberg that Kotlin gives us to make our code correct, safe and expressive. I want to take this a step further, to have the ability to inspect and assess any Kotlin code (in addition to the code snippets presented in these articles). I needed a tool to understand, how Kotlin compiles down to Java/Dex bytecode, and what precisely the Android runtime is seeing.
After thinking a lot about this I hacked the following tool, that actually follows my workflow, as I sit down and analyse the performance of my Kotlin code. I start with Kotlin code that I have in an IDE (IntelliJ IDEA or Android Studio). Then I check the kotlinc generated class files (learn more about Kotlin build process). The binary code (inside class files) is not human friendly, like any other binary format. However one of the key strengths of Java, is the Java language syntax is very close to its binary representation. So in majority of the cases, inspecting decompiled Java code provides good data for performance analysis. In the remaining cases, the only solution is to look directly at the binary.
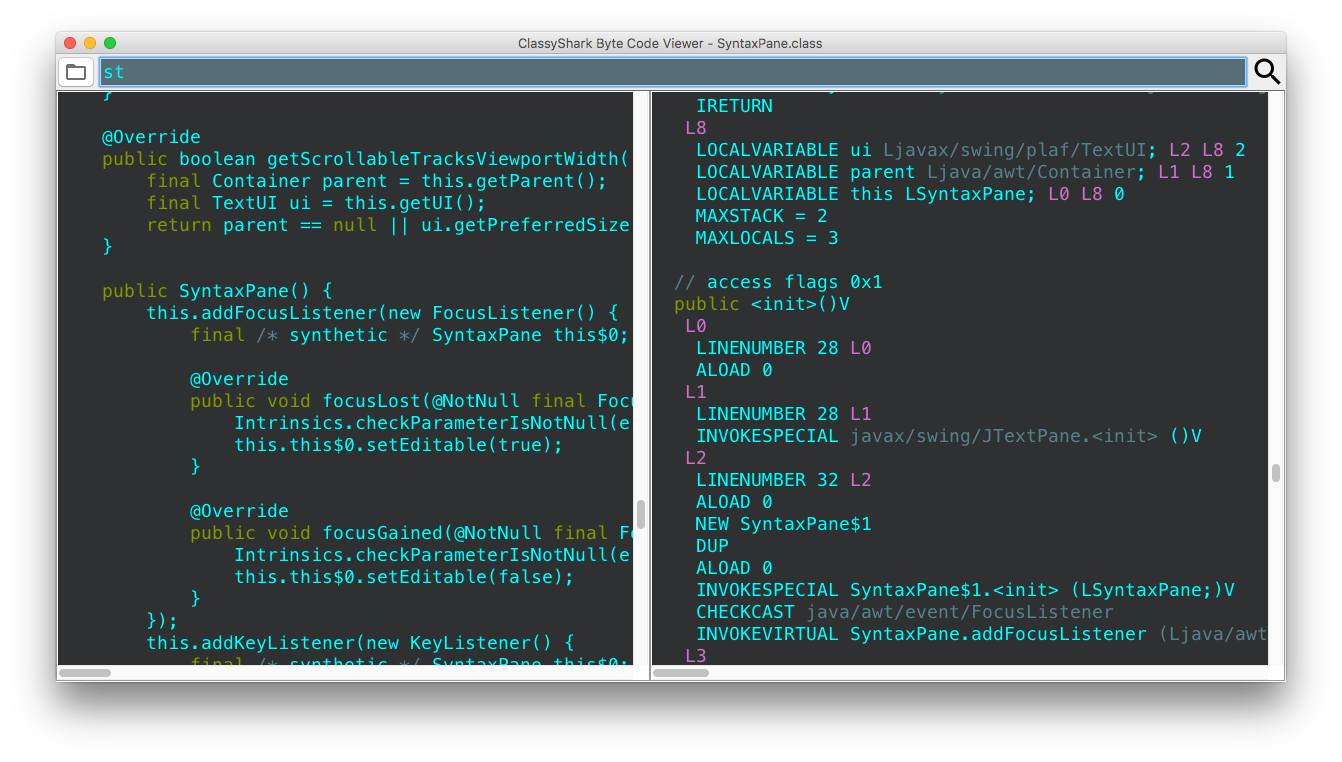
This is how ClassyShark Binary Viewer looks and feels. For every loaded class file, the left panel shows the decompiled code, while the right panel shows the same code but in binary mnemonic representation using ASM (still close to JVM level but way better than remembering the opcodes and string tables by heart :)). Grab a download of the Viewer here.
For example I use the left panel to see which and how many methods and fields the Android runtime sees, while I use the right panel for a specific hot method, checking if I can optimise it further say by replacing invoke dynamic with other alternatives or avoiding in-method allocations.
For completeness, IntelliJ IDEA has a bytecode viewer and a decompiler to achieve the same goals :). One of the reasons I thought of a separate tool was control over the decompiler choice to demonstrate Kotlin cross tooling and UX scheme, combined with curiosity to understand how things work, and customise them. As an added benefit with ClassyShark Binary Viewer you can inspect class files even if you don’t have the sources, or the source files, that are not part of your open project or module.
In general ClassyShark addresses the problems of method counts, packages and dependencies, while the ClassyShark Binary Viewer focusses on drilling down to the lowest level, to pinpoint specific problems and bottlenecks.
I am still feeling that this is only a start, so many bits and pieces are still moving. Would love to hear comments, pull requests and suggestions.
Happy coding !