Debugging Native Crashes in Android Apps
A Simple End-to-End Example
The 100 most popular Android applications have been installed 54 billion times (as of December 2018). And 85% of those apps contain native code with 1000+ individual native libraries. If you’ve worked on any of those 100 applications, or on similar large applications, that’s a lot of opportunity for something to go wrong!
Android developers should be comfortable debugging native crash stack traces (“tombstones” in Android-speak). But crashes on the native side (i.e in low-level C/C++ code) are often complicated and hard to understand. Not only that, but they can crash the JVM (Java Virtual Machine) before returning control to the Java/Kotlin code. This means you can’t catch the exception at your application level, providing a terrible user experience!
Before We Get Started
The Android developer documentation provides a lot of useful information for diagnosing native crashes, but there is a lack of useful and comprehensive examples to learn from.
Note: If you’re unfamiliar with native code on the Android platform, it couldn’t hurt to check out the Android NDK guides as well.
Native libraries are useful for many applications, but some of the common use cases include:
— Squeezing extra performance out of a device to achieve low latency or run computationally intensive applications, such as games or physics simulations.
— Reusing your own or other developers’ C or C++ libraries.
Additionally, native libraries can provide increased application security and can be reused among cross-platform applications.
Some Real World Context
Over the last couple of months, the Android SDK team that I work on at Capital One began integrating with a third party library that includes some native code. The vendor’s shared objects (.so files) were also pre-obfuscated, which makes debugging any crashes difficult.
Perhaps the shared library included in your application is already obfuscated and you need to prevent “double obfuscation”. If you don’t prevent additional obfuscation, there is a high chance you’re going to run into a problem.
During integration with our app, we noticed a runtime crash only present in our release builds that were obfuscated. Uh-oh! Code obfuscation is critical to the security of our application, so we needed to fix the crash quickly before the next release.
Quick shout out to @VarPete / Panayiotis "Pete" Varvarezis for his help debugging the crash and pointing me in all the right directions!
So, we put together a solution for debugging this problem... Alright, let’s take a look at a simple example application and apply the analysis and debugging steps that we worked through to resolve our native crash.
Example Application — NativeCrashApp
Note: This example application would make no logical sense in a production app, but is used solely as a teaching aid. So, without further ado…
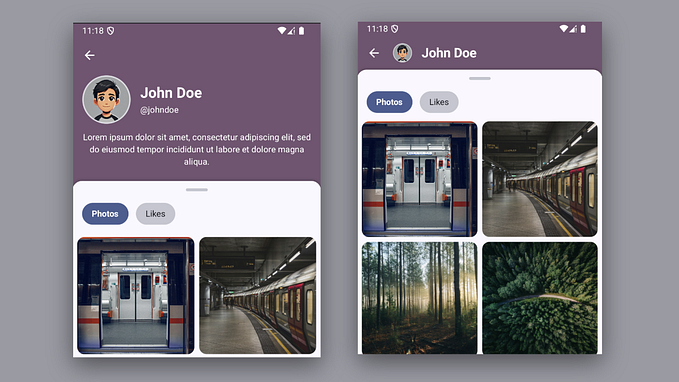
The application’s flow is simple (and unnecessary), but includes some interesting behavior. The primary and singular function is to display to the user the name of their device in a consumer-friendly format — not the lifeless model name returned by Build.MODEL. We’re making use of Jared Rummler’s AndroidDeviceNames library for this purpose.
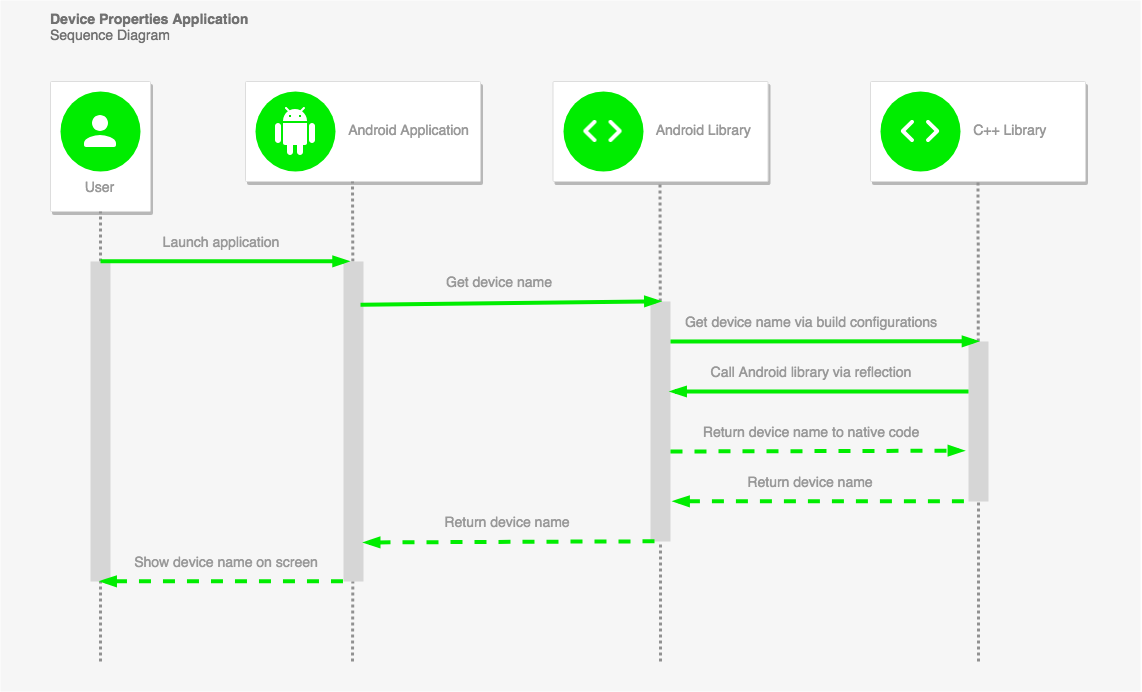
Here’s the flow…
1. The user launches the application
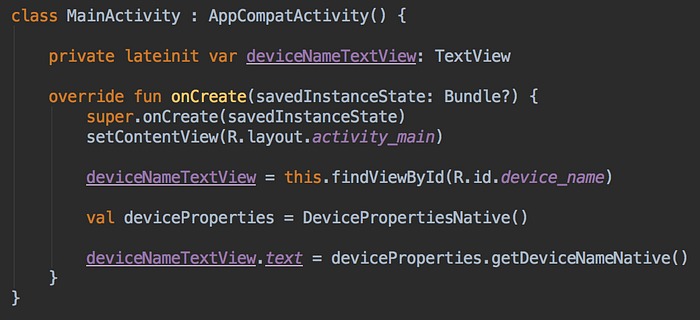
On launch, the application looks up the device name with our custom Android library.
2. The library calls down to the native level
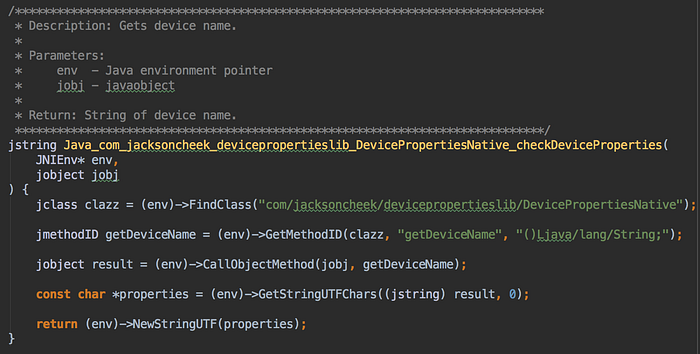
The native level (our C++ library) is called through the JNI (Java Native Interface).
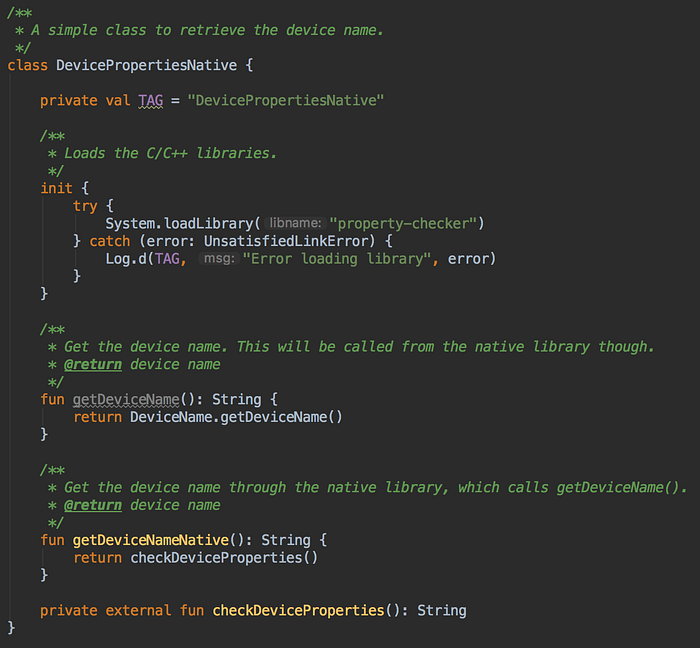
3. Calling back to Android library via reflection
The Android library is invoked via reflection to check the device’s human-readable name.
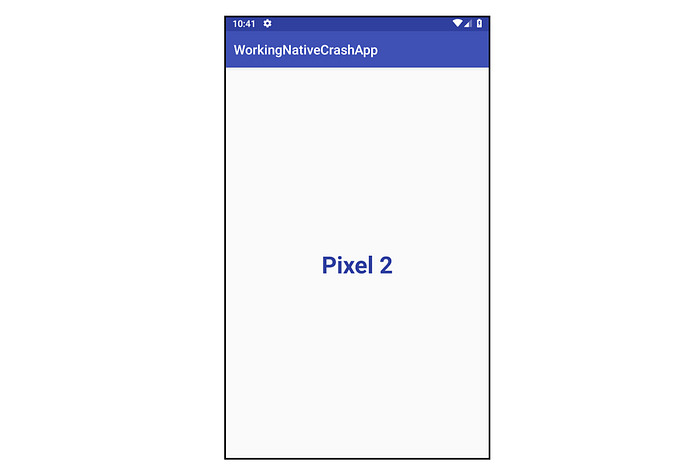
4. Return device name back up the chain
And finally, we return the device name back up to the application and display it on the screen. What a ride!
Note: Obviously, this could have all just happened in the Activity. The Android library and C++ library are totally unnecessary. But, this is more fun.
But, What About Bugs?
For the purpose of this exercise I’ve sneakily added some! Now, check out the broken product flavor in the project repo and you’ll find a few bugs that need debugging before the happy path works as described above.
Code Shrinking and Obfuscation
As responsible Android developers, we want to improve the security of our application by leveraging code shrinking and obfuscation. So, let’s apply our code obfuscation tool of choice, such as ProGuard! This process detects and removes unused classes, fields, methods, and attributes from our packaged app.
android {
    buildTypes {
        release {
            minifyEnabled true
            proguardFiles 'custom-proguard-rules.pro'
        }
    }
}
Bug #1
Unfortunately, as we test a release build of our app, we uncover a crash.
There’s no implementation for the class com.jacksoncheek.a.a.a(boolean), but we don’t know what that is. Let’s check the mapping file mapping.txt that ProGuard outputs. It contains a translation between the original and obfuscated class, method, and field names.
com.jacksoncheek.devicepropertieslib.DevicePropertiesNative -> com.jacksoncheek.a.a:
    java.lang.String TAG -> a
    boolean libraryLoaded -> b
    boolean nativeLibraryLoaded() -> b
    java.lang.String getDeviceNameNative() -> a
    java.lang.String checkDeviceProperties() -> c
    void setLogDebugMessages(boolean) -> a
    void <init>() -> <init>
OK, now we know that ProGuard inappropriately obfuscated some of our code. This type of error is common with obfuscation.
Pro-Tip: ProGuard doesn’t check the native code, so it won’t automatically keep the classes or class members that are invoked via reflection in the native code. Time to -keep any of those methods also!
-keepclasseswithmembernames,includedescriptorclasses class * {
    native <methods>;
}keepclasseswithmembernames— preserve class and native method namesincludedescriptorclasses— keep return and parameter types
Bug #2
So, let’s test the app again. Another (different) crash!
Looks like another obfuscation error.
java.lang.NoSuchMethodError: no non-static method "Lcom/jacksoncheek/devicepropertieslib/DevicePropertiesNative;.getDeviceName()Ljava/lang/String;"This one’s a little trickier. Our class name DevicePropertiesNative, the method name getDeviceName, the parameter types () — in this case void, and the return type Ljava/lang/String can’t be found.
So, we need to preserve the class and native methods from being obfuscated, but also the return and parameter types. This ensures that the entire method signature remains compatible with the native library.
We need to add a special -keep rule in our ProGuard configuration to prevent obfuscating method getDeviceName(). The ProGuard manual provides a lot of information on different configuration options.
-keepclassmembers class com.jacksoncheek.devicepropertieslib.DevicePropertiesNative {
     java.lang.String getDeviceName();
}
Bug #3
So, testing again… a native crash — finally!
This is a segmentation fault (SIGSEGV) at virtual memory address 0xff799ffc, but it doesn’t really provide much useful information. SEGV_ACCERR occurs when a pointer tries to write to an object that it has invalid permissions to access.
It’s time to dig into the logs and find the “tombstone”, the crash dump for native crashes. Search the logs for the start of the tombstone with *** ***.
This information includes:
- Build fingerprint — matches the
ro.build.fingerprintsystem property - Hardware revision — matches the
ro.revisionsystem property - ABI (Application Binary Interface) — the processor instruction set architecture,
armeabi-v7ais the most common for Android devices - Crashed process name
>>> ... <<<(and process ID) and thread namename: ...(and thread ID) - Terminating signal type
SIGSEGV, how that signal was receivedSEGV_ACCER, and the fault address in memory - CPU registers
- Stack content of the call (backtrace)
Native Crash Debugging
Investigating the Backtrace
The PC (program counter) values are the memory addresses relative to the location of the shared library. This is where we’ll learn the most information about the native crash and it’s location in our library.
6759-6759/? A/DEBUG: #03 pc 000008e8 /data/app/com.jacksoncheek.nativecrashapp.broken-MzKT-aIUbK4D4IxEzg3yTA==/lib/x86/libproperty-checker.so (accidentallyForceStackOverflow(int)+56)Our crash occurred at memory address 000008e8 at the top of the call stack in libproperty-checker.so.
The Android NDK stack provides two tools that help with debugging tombstones — ndk-stack and addr2line. Install the NDK tools with the Android Studio package manager and add the NDK directory to your path in your .bash_profile.
ndk-stack
The ndk-stack tool symbolizes stack traces from a tombstone. It converts memory addresses to the corresponding source file and line number from the native library’s source code.
$NDK/ndk-stack -sym <path> [-dump <path>]addr2line
You can also use the addr2line tool to take the memory address where the native code caused the crash to get the source file name and line. It’s part of the NDK tool chain. Make sure to use the addr2line for the device’s ABI type, e.g. x86 (not common), armeabi, or armeabi-v7a (most common).
In this case, the path to addr2line for x86 ABI types is
~/Library/Android/sdk/ndk-bundle/toolchains/x86–4.9/prebuilt/darwin-x86_64/bin/i686-linux-android-addr2lineUsage:
addr2line -C -f -e <libPath> <memoryAddress>Example:
i686-linux-android-addr2line -C -f -e libproperty-checker.so 000008e8accidentallyForceStackOverflow(int)
~/NativeCrashApp/brokendevicepropertieslib/src/main/jni/propertyChecker.cpp:64
Now we know the native method accidentallyForceStackOverflow(int), the source file propertyChecker.cpp, and line number 64 causing our native crash!
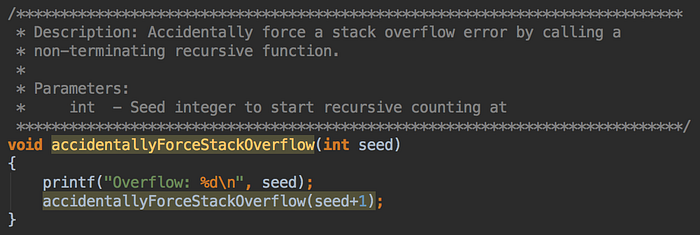
We’ve found our native bug. The library is accidentally forcing a stack overflow error by calling a non-terminating recursive function infinitely. The quick solution here is to remove all usages of this method.
In the real world, you may be working with the release version of a vendor library, so you won’t have the source code to work with. Not all .so files are useful for debugging with ndk-stack because released libraries generally use stripped binaries, which make them harder to debug.
This is where the addr2line tool really becomes useful. If the native method name where your crash is happening doesn’t get printed in the tombstone, which is not guaranteed for all devices, you can use addr2line to get the native method name.
First, decompile the .apk (just unzip it) and extract the .so files packaged in the application from the /lib directory. Then extract the shared library for the device ABI type, e.g. armeabi-v7a.
Note: These files are also located in your /app/src/main/jniLibs directory.
./i686-linux-android-addr2line -C -f -e libproperty-checker.so 000008e8accidentallyForceStackOverflow(int)
??:?
We don’t get the line number or source file where the crash occurred, since the APK only contains the stripped binaries, but we’ve found the method name — accidentallyForceStackOverflow(int). Still helpful!
TL;DR — Native Crash Debugging Steps
- Check for the bug on multiple device architecture types.
- Decompile the
.apkand make sure the shared library (.so) files for each architectures exist. - Check that the Android package manager is correctly installing the native code along with the application by checking that the shared library (
.so) is loaded at runtime. You could use Native Libs Monitor to easily check for apps with native libraries on your device (and it’s easy), but I can’t vouch for the security of using this app on devices with proprietary debug builds. - Add special
-keeprules to your ProGuard configuration to preserve the class and native methods from being obfuscated, but also the return and parameter types. - Analyze the native crash “tombstones” with the
ndk-stackandaddr2linetools.