Building a custom view — a practical example
I enjoy browsing Dribbble. There are many inspiring designs to discover over there. But as a developer, when you receive a cool design, the feeling sometimes switches quickly from excitement to despair when you start thinking about how to implement it.
Later in this post I’ll show you an example of such design and the steps to implement it, but before that, let’s talk about solving the problem in general.
The first instinct might be going the library route. Now don’t get me wrong, I’m a big advocate of ‘don’t reinvent the wheel’. We have great open source libraries, and when I’m tasked with downloading images or creating REST API calls, I’ll need a good reason to not use Glide/Picasso and Retrofit.
But when you need to implement a unique design, it’s not always the best choice. You’ll need to invest time in searching for a good, maintained library that does something similar. Then you should look into the code to see that it’s something that makes sense. You’ll need to invest more time in understanding the tweaks and configurations you can use to bend to library into doing exactly what you need. And let’s be honest, it won’t do exactly that, and you’ll need to do some compromises with the designers.
In these unique situations, I say that it’s often better to build your own custom view. When I say ‘custom view’ I mean extending the View class, overriding the onDraw() method, and using a Paint and Canvas to draw the view. It may sound scary if you haven’t done it before, because these classes have many methods and properties, but you can focus on the main ones:
canvas.drawRect() — Specify the coordinations of the corners to draw a rectangle.canvas.drawRoundRect() — Specify the radius to make the rectangle’s corners rounded.canvas.drawPath() — This one’s more tricky, but also more powerful, create your own Path with lines and curves.canvas.drawText() — Draw your text on the canvas (use the Paint to control the size and other stuff).
canvas.drawCircle() — Specify the centre point and radius to draw your circle.canvas.drawArc() — Specify the bounding rectangle and the start and sweep angles to draw an arc.
paint.style —Specifies if the primitive being drawn is filled, stroked, or both.paint.color— Specifies the color (including alpha value).paint.strokeWidth — Control the width for stroking when the style is either Stroke or StrokeAndFill.paint.pathEffect — Allows you to affect the geometry of a drawing primitive.paint.shader— Allows you to draw gradients among other things.
Keep in mind that sometimes you might need to use other APIs, but if you experiment with these methods and properties, once you master it you’ll be able to draw highly complex shapes.
A real world example
This is a design we were given at Pepper:

There’s a lot going on here, but let’s break it down to smaller pieces.
Step 1 — calculate the markers positions:
We find the min and max values, calculate the pixels per unit ratio, the horizontal step size between markers and the X and Y positions.
Step 2 — draw the gradient:
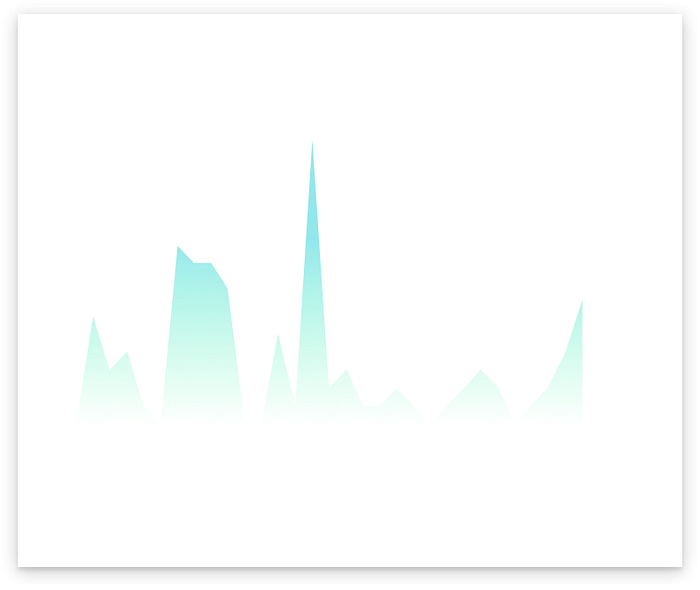
We create a path, starting from the left edge, running a line between each marker, and closing the path back to the initial position, then we draw this path using a paint with gradient shader.
Step 3 — Draw the guidelines (the vertical dashed lines separating the weeks):

We prepare the paint so it has a dash path effect, then we use a special Kotlin for loop that allows us to loop over the markers with a step of 7. For each marker we loop through, we take the X coordinate, and draw a vertical dashed line from top to the zeroY.
Step 4 — Draw the chart line and markers:
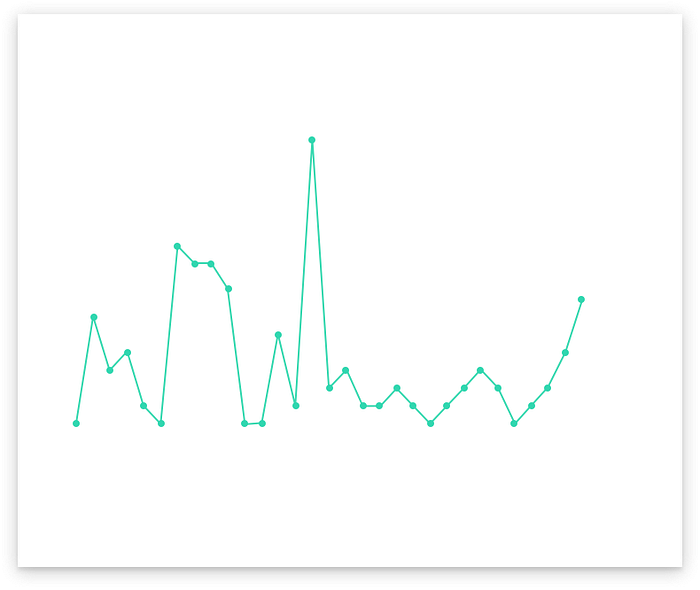
We loop through the markers, draw their circles, and draw a simple line to the previous one.
Step 5 — Draw the weeks buttons (the rounded buttons on the bottom):
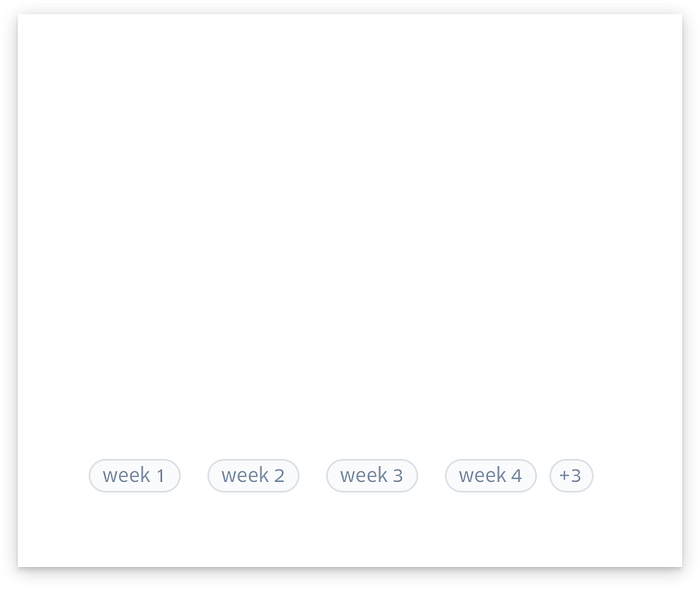
We loop through the weeks labels, find the x position of the middle of the week and start to draw the button by layers — first we draw the rounded rectangle background, then the border and last we draw the text. We manipulate the paint before each layer.
Step 6 — Draw the graduations (the number markers on the right):
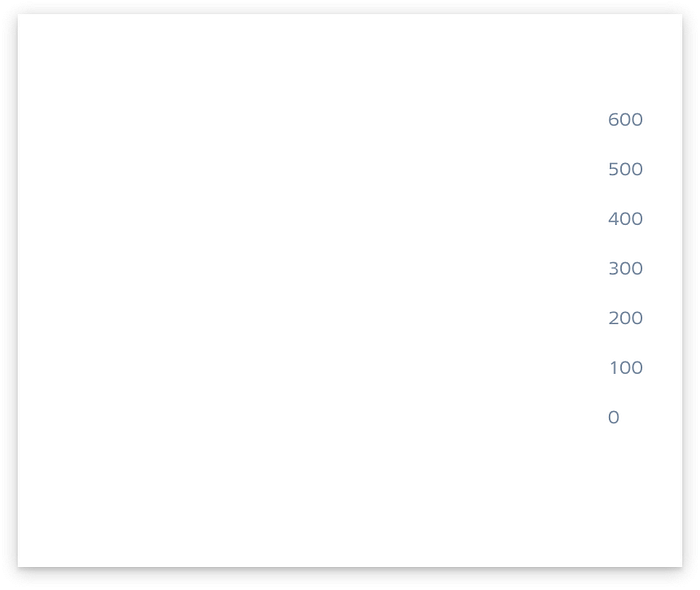
The X position is the position of the last marker plus some padding, then we simply iterate over the values. The Y position is calculated using the pixels per unit ratio. We format the number into a string (adds the thousands separator if needed) and draw the text.
That’s it, now our onDraw() will look like this:
And combining the layers will give us the desired result:
Summary:
- Don’t be afraid of building a custom view (when needed)
- Learn about the main
CanvasandPaintAPIs - Break the design down to its layers, and draw each one independently
As for the last point, for me it’s one of the best lessons for programming in general: when presented with a big and hard problem, break it into smaller, more manageable tasks.