Anatomy of analytics from Google

Anatomy of analytics from Google
Hello everyone!
We are developers (proudly sounds, isn’t it?), and we are actively implementing new features, fixing bugs and trying to make our products better.
In order to understand how our products are used, which features are popular, and which are not, we use analytics. There are many different tools in the market, but in this article I would like to talk specifically about analytics from Google, which is being under active development.
Google Analytics is replaced by a new fighter — Google Analytics for Firebase(formerly Firebase Analytics).
Even in the names you can catch this wind of change. And the wind of change always gives rise to some information vacuum, into which various kinds of rumors come, not always reliable though.
Let’s try to understand in detail, what’s so special about these analytics tools, and which one to use.
While there is a lot of systematized information about Google Analytics,
Google Analytics for Firebase has typical drawback that is applicable for the most of the new products — information is scarce, scattered around and sometimes even contradictory. I spent a lot of time and efforts to figure out what’s what.
And, the main goal of this article is to systematize the knowledge about the current state of Google Analytics for Firebase. It can be considered as some kind of “road map” for Google Analytics for Firebase.
I’m sure this “map” will save you a lot of time and nerves =)
The main myth. Google Analytics is done
Let’s start from the hottest part.
It seems for me, this rumor comes from the very launch of Firebase Analytics. And you can find some logic here, otherwise why would Google have two analytics tools. But Google Analytics (GA) and Google Analytics for Firebase (FA) are two different tools with different concepts and approaches, which we’ll discuss below.
GA is not going anywhere (at least for now) or absorbed by anyone. This information is from Google’s Moscow office and from developers themselves.
GA fans may sleep peacefully … for now. But who knows what will happen next. Therefore, I highly recommend continuing reading =)
GA vs FA. Common concept
FA is an analytics with a completely different concept and philosophy. It is event based and is intended solely for mobile devices. While GA is screen-based and was intended initially for the web, and only then it was adopted for mobile devices.
GA is structured around hierarchical events with one value, FA is more about writing one event with more parameters (key-value pairs). These analytics are very different, and thus cannot be interchangeable.
Migrations from one to another aren’t even considered. But Google is working on a certain compatibility, which we will also talk about a little later.
GA vs FA Events
In terms of understanding the “events” in GA and FA are really very different. And this is especially noticeable in the following example.
Let’s say your application is a game. At the end of the game, you want to send statistics on how user played. And you want to know about user’s total score, the number of killed enemies and the number of rounds passed.
In GA, it will look something like this:
In GA, each event is essentially represents a hierarchy of parameters:category → action → label → value.And in the console itself you could observe this hierarchy. As a matter of fact, you should have been followed this paradigm while coming up with tracking events. Also you can build various filters using these parameters in the console.
But in GA, events have small drawbacks. If you want to add additional parameters to the event, in addition to the above, you have to deal with category→ action → label → value chain, and come up with new names for parameters. It is inconvenient, or at least it was so far.
And now let’s see how you can deal with this statistics in FA:
As you can see, instead of three events we send just one, which is more logical and convenient. About “events” in the FA, we’ll talk in more detail below.
GA vs FA. Console
The second thing these analytics tools differ is console.
Here’s how GA’s console looks like:

“Events” are hidden deeply in “Behaviour” tab on the left. But standard report comes with Category/Action/Label breakdown straight away (image is clickable).

Here’s how FA’s console looks like:

First thing you see is “Dashboard”. And I would immediately draw attention to the User engagement card (clickable picture):

Finally, a proper screens viewer was added to the FA console. We didn’t have it until May. That means we could send “user engagement” event, but cannot see it in the console. It was terrible, and might be one of the reasons why no one wanted to switch to the FA.
As you can see, the Events tab placed just next to the Dashboard, which confirms once again — the FA is tuned to work with events. We’ll also return to the console a little later, meanwhile let’s plunge into the broad topic of “Events” in the FA.
Event in the FA
Let’s look at this code snippet:
You can send up to 500 different types of events in your application, including predefined ones (FirebaseAnalytics.Event.SELECT_CONTENT is predefined, but you can also specify your own types). The total number of events is not limited (source).
For each event, you can attach up to 25 parameters (those put in Bundle). Parameters are also predefined, but nobody forbids you to specify your own custom ones. You can get more info here.
Event types and parameters are ordinary Strings, and they are case sensitive. Same events must match by type and parameters.
In addition, there are events sent by default. You can find the entire list of these events with descriptions here. As you can see, there are a lot of really interesting events that we could not possibly receive before. Awesome!
Also, from the link above, you can read which predefined events and parameters can be selected for certain events.
FA Events. “Devil is in the details”
You may have noticed that predefined names of events and parameters are mentioned with suspicious frequency. And such events with parameters are usually demonstrated in the examples. And this is not by chance. Let’s say you send an event with ten custom parameters, and it will look like as the following in the console (clickable image):

But where are my parameters?”
— You might ask. They just don’t appear in console.
The fact is that all those beautiful graphics are built only when you use predefined names. Using your own custom parameters, you will see nothing. Only “the number of events” and “the number of users”.
And before I/O 17 it was just terrible pain. You could build graphics, for example, using Value parameter, as shown in this article. But, of course, this is not a proper way of doing.
And here, it’s time to remember about GA, where you can build filters any way you want.
But even here there is a small caveat. Building standard reports? No problems. But in most of the cases we need some customizations for our reports. For example, adding a Secondary dimension to sort events by device models. And here comes the terrible word “Sampling”.
Depending on the report, the sampling algorithm in GA works differently. How exactly the sample is selected for each report, Google does not disclose, but in general all the practices are already known. Usually this is either hi-based-sampling or cookie-based-sampling. With the former one, a random sample is selected from all records (events, views, etc.), while with the latter — random sample is selected for all users (using cookies or gaid/idfa, if this is a mobile application).
Therefore, we can not speak about the error for each field.
In practice, it is said that when sampling more than 5%, the error rates in absolute numbers was less than 2.5% for event reports.
For providing information on sampling, I want to express my gratitude to Alexander Sergeyev of Yandex.
FA Events. Continue
It is definitely not easy with these “Events”. And in fact, FA is going towards the wishes of ordinary people.
First of all, there is no sampling in the FA. All data is available there, which is cool, because the cost of Google Analytics 360 (paid version of GA without sampling) is quite big. And in FA you can upload your data to BigQuery and manipulate with them whatever way you want.
Secondly, after I/O 17, it became possible to build reports using custom parameters.
You are directly asked to register your custom parameters in your specific event’s screen (clickable image):

But note that for this application you can register up to 50 parameters (10 text and 40 numeric ones). I tried to trick to bypass this limitation: registered custom parameters with the same name for different events, but it did not help.
Moreover, if you expect to see ready to use reports, I will disappoint you. Reports are built in a cumulative manner. Let’s say you have an “event_1” with a custom parameter “custom_1”, for which you want to build a report. In the console, you schedule a report to build at time X. So, all the events for “event_1” that will come after the time X will be included in the report, while those after X will not be processed. So be careful.
It seems the tool become better, but in reality not much. What’s even more sad, is you can’t combine these reports with one another. Perhaps, we want too much from the console. If you really want to do anything with the data, then welcome to the wonderful world of BigQuery. Let’s slightly unveil this data mystery.
BigQuery
BigQuery is a slightly different universe.
It was possible to work with BigQuery through GA, but only if you have a premium account.
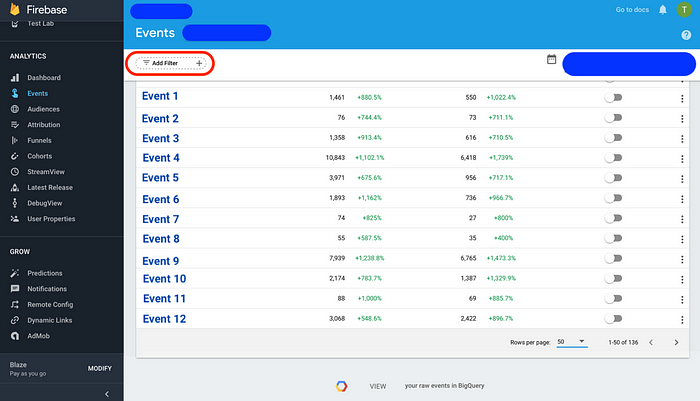
In the FA, you are invited to establish connection just inside Events tab (clickable image):
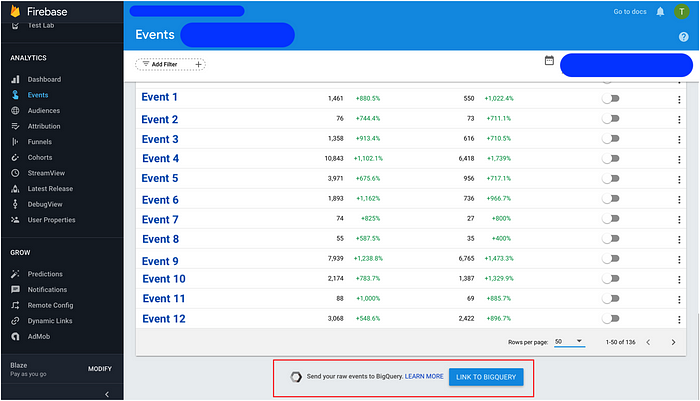
We give you a car, but you gas is on you. © Google
You can read the pricing plans here, or even better here. But believe me, just to try it out, free Blaze plan will be more than enough. And even if you are working with real products, according to colleagues’ reviews, the fee will be quite reasonable.
So, let’s begin our introduction. This is what the BigQuery console looks like (clickable):

You can find available data list in left menu. For example, TestStep is my test project with one application. And bigquery-public-data and Public Datasetsare, as you might guess, public data, which you can practice with in writing queries.
On the right, you see a list of requests, both successful and not.
Now take a look at the test application data for March 14, 2017 ( app_events_20170314 table, clickable image):

I put all the data for a single day into a table (52 events). As you can see, every event is described in details, including all properties, which will be discussed below.
Let’s look at the preview of the data (the Preview tab, clickable image):
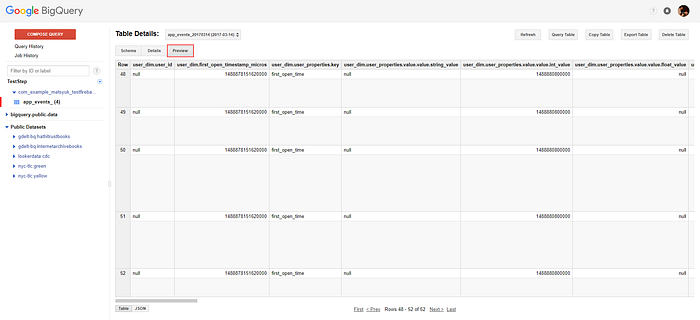
Table view is not that informative. Far more comprehensible option is JSON (picture is clickable).

That’s where our event is fully represented. In the UI, for some reasons, you can not extend the json display window, so I’ll give the full json of the last five events separately: 5 events in BigQuery
Beauty, isn’t it?
Now let’s take a closer look at Queries. Choose the first one (clickable image):

And the next screen (clickable) opens in front of us:

Our request is quite arbitrary. Pay attention to the Results tab, where you will see the results of your request.
If you open the Explanation tab, you will see a more detailed query flow (clickable):

And the most interesting tab is Job information (clickable image):

Pay attention to Bytes Processed, Bytes Billed and Bites Tier. During the request, 26.4 KB were processed, but you only pay by the lower border for Bites Tier = 1, i.e. as for 10 MB. However, according to documentation, first 1TB per month for you will be free, and each subsequent one will cost $5. Quite enough for you to play and try. And an important addition — you pay only for successful requests!
Even a very brief overview of BigQuery turns out to become rather big. This is a very powerful and functional tool which helps you to analyze the data as you like. But you can’t figure it all out in just 5 minutes, unlike the usual console in GA or FA. That’s why it’s very nice to have a person who understands this and who can get any results in your team or company.
If you want to become a such person, then you can start with the introductory video from Google, where the cost calculation is covered as well. Also there are good articles — one and two. Furthermore, I’d advise you to dig towards the official docs and books on BigQuery (the whole book, Carl!).
Would be great if someone had already researched the topic and could share their tips and experiences =)
I also note that there are UI wrappers over BigQuery such as Data Studio, which allows you to upload data and visualize them conveniently. Data Studio is still in beta, but it has a potential to become a very convenient tool in the future .
User properties
We, in fact, continue with the theme of events, since user properties are one of its essential parts.
User properties are the characteristics which you can use to describe different segments of your user base, such as language, geographic location, etc. They are also called sticky params, since they are attached to each event.
Initially, only default properties are attached to each event.
But if you call this in your code:
then the property “license_property” with a predetermined value (the value of “mLicenseType”) is attached to each subsequent event. And even after restarting the application, phone, etc., this property is still attached. Which means property is also persisted.
In this case, you must first register your property in the console (clickable image):

Everything is described here and in APIs.
Note that for a particular application, you can send up to 25 properties (in addition to default properties). The list of properties sent by default is here.
Actually in the console you can filter anything by properties and audience (audience is discussed below). E.g. events (clickable images):

The setUserProperty(…) counterpart in GA are the setCustomDimension(…)and setCustomMetric(…) methods. The only thing to notice, dimension and metric data are not sticky and persistence, and you will need to manually attach each session to each event.
Events. FA + another analytics
I think every application has at least two analytics tools, but usually there are more. Analysts are also progressive people and do not stand still. It is our job to support all those tools, so what’s better way to do?
There is a very good Google article, which I’ve already been mentioned, that describes various options.
I’ll list them briefly so that you have an idea:
- Simply send different analytics data separately. You’ll probably create some kind of universal facade which you will use everywhere.
- Google Tag Manager. This manager is connected and configured through the console. The point is you don’t need any changes in your code (other than build.gradle and adding configuration files), just send your FA events — and that’s it. On their side Google Tag Manager transforms FA events based on the rules you specify to the events you need (e.g. GA, AppsFlyer and other Google Tag Manager partners). Additionally, you can configure all possible triggers for FA events to fall into other analytics (for example, if certain analytics needs only strictly defined events). Sounds very cool and flexible. Unfortunately, I haven’t tried it myself, since it takes considerable time to dive in and figure out what is there. If anyone has experience, please share your knowledge, it would be very useful to understand Google Tag Manager in details. In the meantime, there is an article that can help you to start with. There are few disadvantages of Google Tag Manager. First, you need time to set up all the tags for all events, and just sort all out. Second, you can not use FA and Google Tag Manager to send ecommerce data to GA.
- BigQuery. This applies, of course, to GA and FA, when you need to combine the data. But you can upload data from GA to BigQuery only if you have Google Analytics 360 subscription.
FA configuration features
To configure the analytics in your project, you need to follow this guideline. There is already a built-in Android Studio plugin that does half of the work for you. If you are setting FA first time, the process takes no more than 15 minutes. Want an API? And here it is, quite brief and kind of understandable.
After setting FA up via Android Studio Assistant in your project, you will notice a new file called google-services.json.
This is a special file, which lists all the identifiers and paths that are required for various Google services to work, in our case — for FA to work.
Also in your root build.gradle this line was added:
google-services is a special plugin that parses google-services.json, then converts it to the plain text used by FA. Also google-services adds all necessary dependencies for used Google services (in our case only FA). However, for that you need to add next line at the very end of app/build.gradle:
google-services.json contains all the necessary info to connect your project to Firebase, and not only analytics, but all other tools.
That’s how sample google-services.json looks like.
Using the google-services plugin, this json is converted to a file with set of linesyour_project\app\build\generated\res\google-services\debug\values\values.xml:
Please pay attention to these lines: firebase_database_url, and google_storage_bucket. If you want to add another tool from Firebase you have everything set up already.
More information about the plugin andgoogle-services.json is given here.
Let’s take a look at the real use-case. Suppose we have an Example app with applicationId that equals to com.fa.example. And we have following product flavors:
Next, we want to register the project in FA via the Android Studio Assistant. We follow the instructions and get the Example project in the console with three applications:

If you look into the project’s app/google-services.json, it contains info on your three applications (three flavors with different applicationId). I.e., each flavor has separate analytics.
Also note that you can download google-services.json from any application of your project. But every google-services.json inside your project will be the same and contains information on all the applications in the project.
Next situation. Your Example project is configured with FA. But you suddenly need to add another flavor to the project with a different package name. And for this flavor you also want to collect the analytics separately. Then you need to do the following:
- Add new flavor in
build.gradle - Register new app in console

- Download the new
google-services.json(which now contains information on four applications in the project) and replace the old one.
Next example. Let’s say, you have buildTypes in your project, and it is represented in build.gradle as following:
You add a suffix to the package name for the ultra_debug and debug types Thus, you have three above mentioned buildTypes and three flavors in your project.
You run Android Studio Assistant to connect to the FA project. How do you think, how many applications will be registered in the console and with what package names?
You won’t guess=) The following applications will appear in the console
com.fa.example.debug
com.fa.example.dev.debug
com.fa.example.qa.debug
Why package name has “debug” suffix is a mystery to me. So keep in mind this bug.
And the final example.
You still have the same three flavors in your project. And you want to add another flavor (for example, custom), but it doesn’t require a separate applicationId, and it should also be viewed separately from all the others in terms of analytics:
The situation is complicated by the fact that you can’t add applications with the same applicationId in the console. So what we’re going to do? We do the followings:
- Register a new project (no an app inside Example project, but a separate new project) in console.
- Register
com.fa.exampleapplication in new project. - Download google-services.json from the new Project.
- Substitute new
google-services.jsonas follows (highlighted in red).

Now your android project will have two google-services.json. While building Google-services plugin first looks at the specific flavor folder. If a folder has google-services.json, then the plugin takes it. Otherwise, google-services.json is taken from the app folder. It is quite convenient and flexible.
Seems developer’s life is becoming easier. Register the project in the console, download google-services.json, put it in the app/ (well, that’s in case without flavors and other things), and that’s it. But sometimes there is a need to switch the analytics channel on the fly. And if in GA you could specify the id in code, this option is missing in FA so far. Initially, I had hoped the following construction would work (taken from SO):
But there is an error: «Missing google_app_id. Firebase Analytics disabled». The Firebase team knows about this and is gradually working on this problem.
You can read about these examples in more details in above mentioned articleon google-services-plugin and here.
Sending data
There is the setLocalDispatcher(…) method in GA, where we can specify the periodic data sending interval. It’s good that FA cares about us and our bandwidth and does not allow us to tune this parameter ourselves. But in GA, using the setLocalDispatcher(-1) method, we can cancel automatic dispatch of events, and manually dispatch the accumulated events with the dispatchLocalHits() method. This is very convenient when, for example, we do not want to send events before an agreement is accepted.
FA doesn’t have a such possibility of accumulating and sending events, it is necessary to do it manually.
But at least there is a method setAnalyticsCollectionEnabled(boolean enabled), which we can use to enable or disable analytics. For example, if we do not want to send any data before the user accepts the necessary agreement, then we write in the manifest:
And then, when needed, we call:
Also you can disable analytics permanently. I.e., even calling setAnalyticsCollectionEnabled(true) won’t help. For this purpose we declare in the manifest:
Information from this article.
Realtime mode and debugging in FA
Events from real devices come to the console only after a day in FA. And it was impossible in the beginning to view the user’s actions in real time. To see the first data, you had to wait a whole day. Now you can use the StreamView/DebugView tab (clickable image):

The image above shows StreamView, where you can see how users behave at this time. You can also select the Snapshot mode (the USER SNAPSHOT button on the bottom right), and you will see the actions of a randomly selected user (clickable image):

DebugView looks similarly. Finally, you can debug in a real time. You will see all the events and properties that are sent by your application, including events and properties by default. As you can imagine, before DebugView the debugging process was truly awful.
This article has a good coverage for StreamView and DebugView
Session in FA
We all see words like “session”, “number of events per session” in analytics context. And, probably, the impression is that the session = the lifetime of the process. But this is not quite correct. A session is just a time period during which your application is active (located in foreground). The FA API has these methods:
If you run the application and kill it in less than minimumSessionDuration, then session does not even start. If the application is running on the foreground more than minimumSessionDuration, then the session starts.
If your application has been killed by the system, but managed to restore before the expiration of sessionTimeoutDuration, then it will be the same session. If you start the application, do something there, then left it (that is, the application is not in foreground), and only after sessionTimeoutDuration+ come back (but the application was not killed, for example), then the first session will end and the second session will start.
A few more things about FA-console
Audiences

New audience creation (clickable image):

Let’s say you need an audience for “Men from Russia who have been registered.” To create such an “audience” you select following properties: “country” = “Russia” and “sex” = “male” and event “reg_completed” (this is your custom event) = “true”.
Funnels
You have the opportunity to build different funnels on this tab (clickable image):

Marketing people love this stuff =)
Note that GA has the same functionality as well.
There are also Attribution and Cohorts tabs. But, frankly, I did not use them so far. Probably analysts can better advise on what they are needed for.
A full description of the console can be found here.
FA. Conclusions
This article turned out to become considerable in size at the end. Let’s try to sum up.
Pros:
- FA is an actively developing product. I have been watching its development approximately since February and I’ve noticed development team is trying to implement features based on user needs.
- FA events + BigQuery. This is the main advantage of FA. You have access to all the events of your application for almost free. And if your team has a BigQuery expert, then you’re damn lucky. In addition, the “events” in FAare much more flexible and convenient to use.
- Minimalism. Only the most necessary things are in console. The emphasis is on “events”. In GA a lot of stuff is mixed up, and most of them are not even needed.
- Integration with other Firebase projects. Whether it’s a crashes collection or RemoteConfig. The products really complement each other, and this opens up new opportunities.
Cons:
- There’s still loads of work to do, especially in the console. But we believe in dev team
- Information is scattered around. That’s what I told in the beginning of the article. Each question needs a deep research. Lack of systematization is misleading at the beginning too. But this article is meant to eliminate this flaw.
I am often asked whether it is worth using the FA or not. Maybe GA itself is enough? Or there is no need to use both of the analytics tools at the same time for your product?
There is no single answer. It all depends on the needs of your analysts and marketing people. In addition, the ability of your analysts to work with BigQuery is another factor.
Still, developers are like the chess pawns in the analytics area, we do what they tell us.
But personally, I would consider FA+BigQuery. It is very cool, and you are not limited only with the console capabilities.
Thank you very much for reading till the end! Write comments and suggestions! Let’s make our developer’s life better!
P.S. Many thanks to Timur Akhmetgareyev for his help and not leaving me in trouble =)
Authors:
Eugene Matsyuk
Alexey Bykov
Roman Yatsina
Atabek Murtazaev