Analyze and improve Android app performance with System Tracing
How do you know what happens underneath the user interface?

When you tap on your app icon, it launches, you feel that it’s slow. Well, it’s slow, what should you do to fasten the startup time?
Then you’d google something like “how to speed up android app startup time” or “best practices for android app startup time”. That’s a good way, but all the instructions would come to this fundamental:
In order to have good solutions, you need to understand the real problems first.
You’re about writing code, debugging issues and testing your apps every day. But do you know exactly what happens underneath the user interface?
What you could learn from this article:
- How slow is your app — performance profiling (measurement)
- What makes it slow — performance issues (analysis)
- How to improve situations — performance practices (strategy)

Performance profiler tools
We’re lucky enough that nowadays Android Studio and Android Developer Options provide us many powerful tools to profile app performance.
Android profiler
Integrated effectively in the IDE, this tool helps android developers analyze CPU usages, memory allocations, network traffics, energy drains…

But, looking at the graphs, it’s too general to know which parts of the app is performing well or not. Then diving deeper into each chart, you can even analyze how each line of code affects CPU usage or object allocations… But it seems to be too detailed and takes a lot of time to tinker and understand all the info it provides.

GPU rendering
This is a good tool to see if your app is being rendered smoothly by visualizing the rendering speed of each frame right on your device’s screen, with the benchmarking line representing 16ms per frame or 60 FPS.
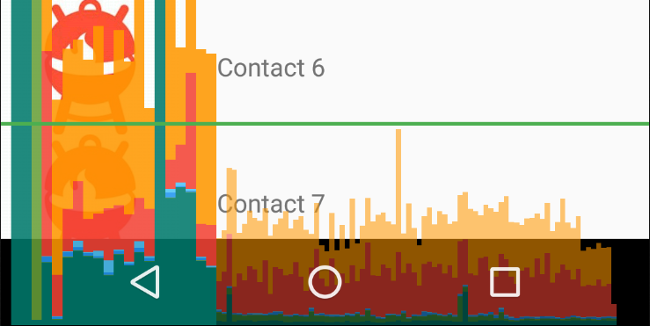
You’d know that if any of the bars are higher than the green line, it’s not good and should be fixed somehow. But how to fix it? You are still blind to which parts of your code are causing the problem.
Looking for a better tool?
Even though Android Profiler and GPU rendering tools are good in some situations, but they don’t really help to find real problems effectively.
There are some others, like monkeyrunner, GPU overdraw, GPU view updates, or more manual approaches such as printing time measurement for particular block codes… but the best tool to effectively analyze what happens underneath your apps, for me, is System tracing.
System tracing with Perfetto UI

System tracing is a tool that lets you collect precise timing information about what’s going on on your device.
And Perfetto UI plays an important role in not only visualizing system tracing files but allowing us to interact and analyze the results easily:
- From the big picture to very high detail of what happens on each thread in each process.
- Measurements for each thing are presented clearly on selectable hierarchy trees in the timeline graph. Such as “activity start” needs 150ms including 100ms for “layout inflation”, some for resource retrievals, and some for class verifying; then so on for “layout inflation” which needs 10ms for the
SeekBar, 5ms for the image view, some for layout measurement and more… - We don’t expect to find exactly which line of code causing performance issues but more important that we know which things are done at certain points in the timeline so the issues can be spotted out easily, also proposing improvement strategy becomes easier and measurements of such improvements are possible — to be sure that it has been improved indeed.
I won’t explain how the tool works or how to use it step by step as the above documentation does those well already, but show some practical examples that I did on my apps published on Google Play: QR code reader and Smart Lens.
So, I suggest you have the first try with this tool first, try capturing system tracing of your app when it starts up and the first activity displayed on the screen, play around the result, then come back this article to see how I analyze performance issues in my app.
Note: all of the below measurements (ms) were done on the debug app which is much slower than the release app. And each time running systrace, the result can be different a bit as it depends on system conditions at that time. So basically we need to run multiple times and take the average value. It’s possible to run it against release builds.
App startup time (exclude the first activity)
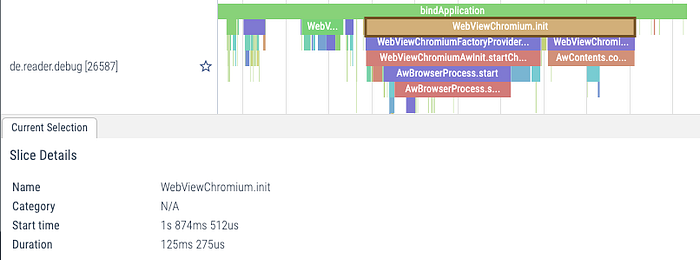
Total app startup time (excludes the first activity) is 1030ms. I was so surprised that why the WebView initialization is done when the app starts up, it’s weird.
First startup problem: Ads initialization
I realized that AdMob banner uses WebView and because MobileAds.initialize(…) was called in app’s onCreate() following AdMob instructions ¯\_(ツ)_/¯. All of those initializations are done on the main thread and block the UI, not only 125ms for the WebView but >200ms more for loading so many classes relating to AdMob.
Solution: initialize ads lazily after the main activity gets resumed and when the app loads the very first ad banner. Then the app started much faster:
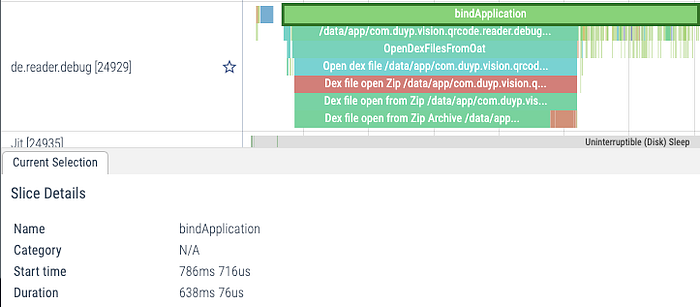
It was awesome, around 400ms had gone and the app needed only 638ms to start.
But again it still stuck at resuming state of the main activity for a while as the ads initialization had been moved there, still on the main thread. Finally I found that it could be done on background threads with no problem and all of those initializations had definitely gone from UI blocking works. Problem solved.
Second startup problem: Database initialization
The first access to the database is when the very first QR code is recognized from the camera, to store that code in recognition history. It means that I don’t need to initialize the database when the app starts.
Solution: lazily init and provide database dependencies, only when it is accessed the first time. There are techniques to do that, either providing instance using the Dagger DI framework if you already had it or manually using the Singleton pattern.
I also found some redundant object initializations at startup.
Wrap up for app startup time:
- lazy initialization: things which aren’t required when the app starts up should not be initialized in the app’s
onCreate(). - lazy dependency injection instead of static objects, eg. using Dagger to init and inject instances lazily.
- move works which can be done on background threads off the main thread.
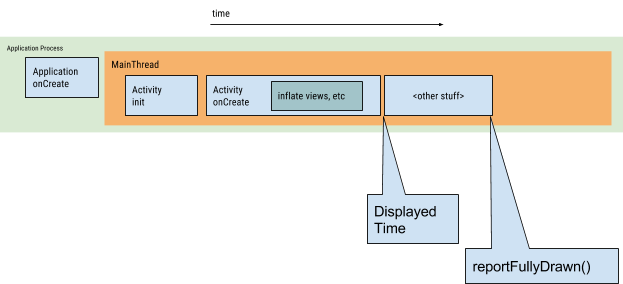
Activity startup time
As soon as the app process has been created, it will do the next steps to create the app object and launch the first activity on the main thread as following visual representation:
First problem: redundant launcher activity
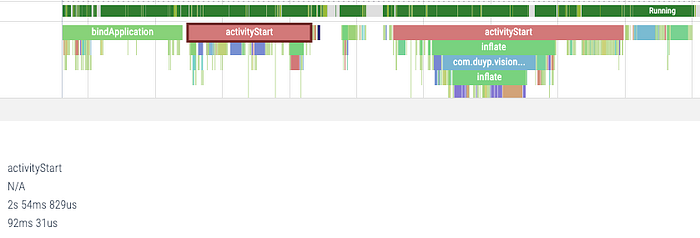
Looking at the above systrace result, we see that there are 2 activities launched at startup: one is the splash screen and one is the main screen. The splash screen takes 92ms.
I didn’t implement something wrong but wasn’t an optimal way to have a splash screen without stealing any amount of time of the user. Following this amazing idea, I could reduce that redundant activity but still achieve the same result (showing app logo instead of the blank white screen), saved ~100ms.
It introduces more initialization logic into the main activity, but with a good code organization, it shouldn’t be a big deal.
Second problem: access camera on main thread
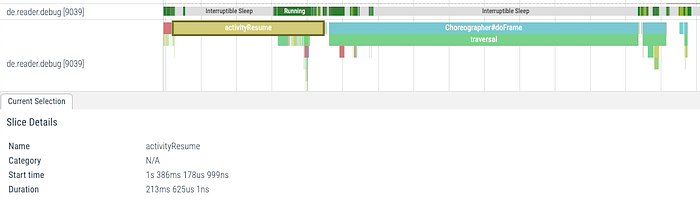
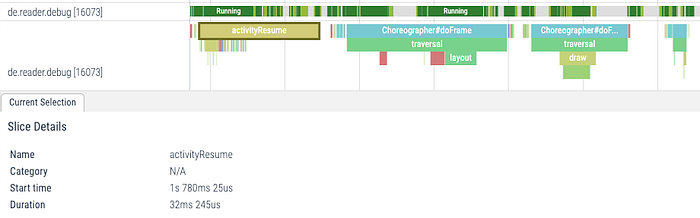
Continue exploring along the timeline, I found that activity resume takes 213ms which is too much. After investigating, the problem was clear that I initialized camera stuff on the main thread which is not recommended as it’s a heavy job.
A lot of works had to be done in order to access camera instance on a background thread, it’s quite complicated and requires a solid understanding of handler and thread synchronization. But it’s been absolutely worth:
Third problem: layout inflation
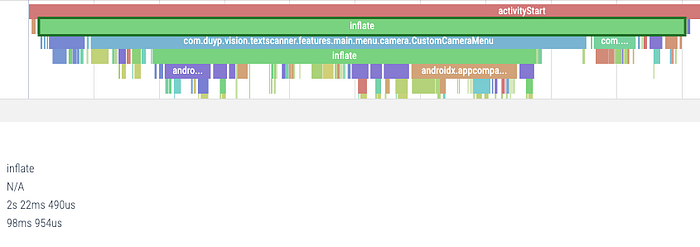
CustomCameraMenu takes 80% of the whole screen’s layout inflationThe whole screen’s layout inflation takes 98ms and inflating the CustomCameraMenu is terrible (75ms).
I found that there are some buttons on the menu that could be lazily inflated with animation using ViewStub. That could help to improve layout inflation time at startup. It doesn’t mean that we don’t show the buttons, but we can postpone some view inflations to the next rendering frame, with the goal of 16ms/frame (60DPS).
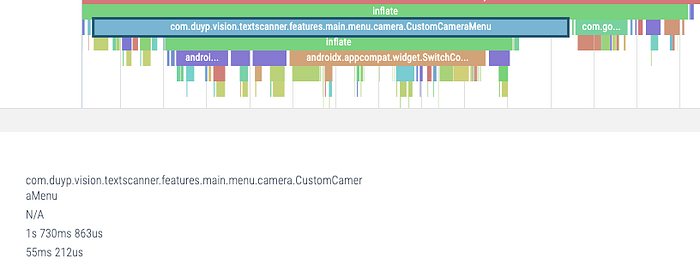
Improved CustomCameraMenu (55ms)More about layout inflation problems and strategies will be described in the next section.
Don’t forget about object initialization in onCreate() of the activity, the same as the above app’s onCreate().
Wrap up for Activity startup time (pretty similar to the app startup time):
- lazy object initialization instead of always initialize when the activity starts.
- heavy jobs (i/o, async, computations…) should be done on background thread if possible.
- lazily inflate some parts of the layout if possible (consider UX).
- the views which are GONE or INVISIBLE when the screen is displayed shouldn’t be inflated immediately, using ViewStub instead.
List scrolling
We often verify scrolling smoothness on RecyclerView by measuring rendering FPS, such as using this tool to dump system rendering time of the frames. But we are still blind to know why it’s slow.
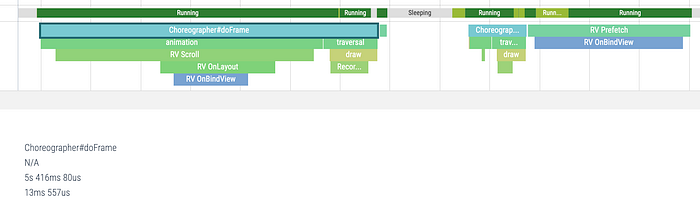
Same as the above approach, we can record system tracing while scrolling on a list of items. The most painful part is the layout inflation that the item’s layout is not designed well and the layout updates based on the item’s state require too much re-measurement.
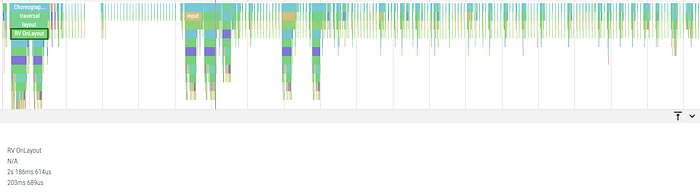
The first 2 items take 203ms to be inflated and added into RecyclerView. Zooming in to see it more detailed, there are some views that are always inflated even though they are not always visible for all items. They could be inflated lazily using ViewStub depending on the state of each item.
But RecyclerView reuses items that were created before for subsequent items. That’s why you see on the above systrace result, the first items take much longer time to be inflated and displayed but when scrolling down, it doesn’t need to inflate items but only bind new data to existing items:
Therefore, depends on UX needs and also the characteristics of your items, you can consider:
- inflating everything and show/hide views when items are bound (slow at the beginning but fast scrolling later)
- or lazily inflating some parts of the item depends on its state, make sure that rendering frames while scrolling shouldn’t take more than 16ms/frame on the release build.
And there are some common mistakes:
- using the same type for different item types: such as adding header for each page by placing the header view in all items but only show it on the first item of the page.
- dynamic item view updates with too many layout constraints causing show/hide some parts of the item when it is scrolled to require too much layout’s re-measurement.
Background threads
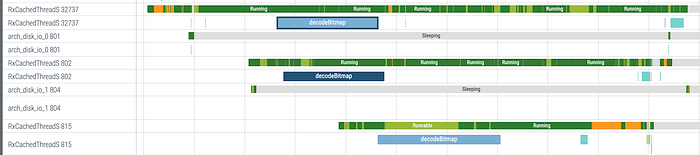
Besides UI and rendering threads, with System Tracing you can also analyze what’s going on with your background threads.
The visualization of background thread works is not that much detailed than UI thread but anyway we have an overview of the whole process and sometimes it helps to find bottlenecks.
TL;DR
System Tracing is the most important tool for debugging performance issues for our team, and also for the Android Performance Team according to Carmen Jackson’s short introduction.
Not only easy to use but also providing so much helpful information, it opens the opportunity to measure and analyze performance issues of any android app, eventually helps us to find improving solutions much straightforward.